
http://dx.doi.org/10.15649/2346030X.2583
Big Data Analytics in the Agribusiness Supply Chain Management.
Marisol Valencia-Cárdenas1
Jorge Aníbal Restrepo-Morales2
Francisco Javier Día-Serna3
- Tecnológico de Antioquia Institución Universitaria, Medellin – Colombia. E-mail: mvalenci1@tdea.edu.co Autor de correspondencia
- Tecnológico de Antioquia Institución Universitaria, Medellin – Colombia.
- Universidad Nacional de Colombia, Bogotá – Colombia
Received: May 19th, 2021.
Accepted: August 18th, 2021.
Published: September 1th, 2021.
Atribución 4.0 Internacional (CC BY 4.0)
Abstract— Importance and impact of the systems related to Agribusiness and Agri-food, are increasing around the world and demand a paramount attention. Collaboration in the inventory management is an integral part of the supply chain management, related to proactive integration among the chain actors facilitating production and supply, in especial in the agroindustrial sector of the Departamento de Antioquia, Colombia. This research establishes the main relationships between latent variables as collaboration, technology, models, optimization and inventory management, based on a literature review and applying a Structural Equation Model to a survey data of a sample of agribusiness companies. The results show that Available Technologies associated with Big Data, generates improvement of Collaboration Strategies, improving also Forecasting and Optimization; besides, Inventory Planning and Collaboration are related to Available Technologies associated with Big Data. A Poisson regression model and a Structural Equation Model estimations detect that the increasing strategies of technologies and Big Data are favorable to apply collaboration in the supply chain management, increasing possibilities to the enterprise competitiveness.
Keywords: Structural Equation Modelling, Poisson Regression Model, Big Data Analytics, Agroindustrial Business, perishable products.
The current fourth industrial revolution requires proper analysis and plans for companies and superior education institutions. Nowadays, the academic community is interested in explore and describe the current state of small and medium-size company’s technologies, due to a possible lack of competitiveness and resources required to be sustainable.
The financial sustainability of Small and Medium-size Enterprises, SME’s, have problems related to their performance [1], [2], but an improvement of these aspects is not an easy task. One of the important factors of the fourth industrial revolution (Industry 4.0), is the pillar “Big Data Analytics”, which comprehends the data capture, and Predictive Analytical Models, inherent to key aspects of an industry, as the dynamic demand of perishable products, especially in the agro-industrial sector, considering that anticipated estimation could improve significantly the operative planning of fluctuating variables for SME´s.
Agribusiness systems represent integral development and relations, as much as economical as social and institutional [3]. This industry includes agricultural supply, production, collection and storage, raw materials processing, and consumption attention [4]. As any kind of industry, this also demands technology, as the Big Data Analytics for the decision-making processes. In the Supply Chain Risk Management (SCRM), special cases occur in the financial analysis, and also for the cost analysis in the inventory requirement. These processes also require quantitative models for forecasting and production analysis, and optimization for a good supply chain management but not many of these SME´s use them [1] despite of its importance for improving the inventory management [5], in especial, for perishable products. Frequently there is a low knowledge and lack of technology in the SME´s about these aspects or little investment and inadequate research, but despite the lack of skills and capacities, Big Data Analytics can support the decision-making process to face the new market competitiveness to be economically sustainable.
Big Data Analytics comprehends the data capture, and storage data, requiring capacities to data management, before doing statistical and mathematical models, helpful in the industry for such decision-making process mentioned. Some of these models apply to help reaching some of the principal firm goals, such as cost minimization, profit maximization, inventory level minimization, or demand analysis, trying to reduce the uncertainty caused from strong fluctuations [6], [7]. These changes and fluctuations can frustrate the estimation for long trend forecasting affecting the performance of some models. Thus, organizations contemplating inventory storage, often face dynamic behaviors where, inventory models with static factors, are not enough to an adequate representation of their supply system. In this sense, literature shows models to forecast the demand under uncertainty and randomness; some of these also consider, inventory models involving probability distributions for demand [8], [9].
For inventory management, the collaboration is increasingly a more interesting topic for the industry and for researchers, due to the benefits generated from this, like reduction in costs, and service improvement, among others, as it is pointed in [10].
Dimensions related to Big Data Analytics are included in this document, as latent factors, which are expected to find correlation with observable variables measured with an applied questionnaire to a sample of companies, but these observable permits to build the latent dimensions as factors, and their association with the regression components through the Structural Equation Modeling, statistical technique that uses correlations among variables. In this sense, this research proposes to analyze the main relations among latent aspects in the industry: Available Technology which includes Big Data Analysis with Inventory Planning, Modeling, Optimization and Collaboration in the inventory management using the Structural Equation Model (SEM) with the R program [11].
This paper is organized as follows: in the first section it is presented a literature review about topics related to latent variables of the research: collaboration in the industry, statistical model formulation, optimization strategies, available technology, and inventory management; in the second section, the work hypotheses are proposed, in the third, the structural methodology, in the fourth, results, discussion, and analysis, and in the last, conclusions.
According to the literature review, the understanding of OR (Operation Research) strategies in a company, and also, modeling and optimization, are required in order to reach adequate levels of profits derived from operations in the supply chain management.
In a dynamic supply chain, important aspects should be carefully managed, as the material and financial flow, inventories and information systems, but also, forecasts that vary from down to up [12][13]. In this sense, raw material is a fundamental factor, because it has a strong relationship with the fast production activities carried out, according to the short life cycle of their products. Procurement and inventory of raw material are highly key factors in daily industry, particularly for processing activities, which require a good integration of the whole production chain and an appropriate information system [14].
Other strong factors are raw material handling, storage, scheduling, inventory, capacity, welfare of the employees, and organization. It has been demonstrated that all of them had a direct impact to the procurement and inventory activities as part of the supply chain management [15]. A higher negative impact can occur on SME´s because more lacks are found on processing, technology, and software; these aspects affect significantly the supply chain activities.
Different countries present several common problems related to the agribusiness system, such as, quality, seasonal raw material, raw material short life cycle, lack of permanent supply, and infrastructure and technological deficiencies, among others, which to do difficult the appropriate connection with logistics [16].
This is one of the reasons why logistics is an important factor for these companies. Logistics has the scope to make goods available where and when are needed and in the adjusted quantities [17]. Hence, logistics is a function for the supply chain operation, due to the integral vision of the elements which compose it: supply or input logistics, manufacture or internal logistics and order fulfillment or output logistics.
Besides this, current research affirms that a Digital framework of the supply chain is necessary to make integration, analytics, automation, but also, digital processes on plan, source, produce, deliver and return [18], that means a transformation of the company and education of human resources.
a. Agribusiness system
Agribusiness systems make a transformation from agricultural products to food or other products not for consumption, also supporting a supply chain from the producer to the consumer [4], requiring information interchange among different actors not only in production, or supply chain, but also for the clients, supported with digital technologies.
Also, these data flows are necessary for models estimation in production, inventories and supply, for the respective internal area at the company, which should not ignore perishable products consideration at management research [5], for quality but also in marketing or economical concerning.
Prices of technology can be negotiated to produce more benefits. Besides, the seasonal behavior of the sales determines the marketing strategies by period, also benefiting the inventory planning for future incomes. In this sense, a good prediction is also an important issue for sales of perishable products.
Multi-period planning is a requirement in the agribusiness operational planning [5], because of time-dependent characteristics of these type of products, to maintain their good quality. Multi-period inventory models have important impacts on cost minimization or profit maximization, taking into account the incomes and costs after sales ([19], [20]).
The agribusiness sector in Colombia has some complex enterprises working under a supply chain integration, with activities of strategic interchanges. Clusters, industrial parks, and enterprise networks are some particular strategies that contribute to the collaboration in the sector which they belong [14].
b. Predictive models
1) Models in the supply chain. Predictive analytics, or predictive modeling, is one of the key aspects of the industrial world; operations where it is frequent to deal with many variables, registers, and techniques to analyze information, process estimations for anticipated planning; in addition, they’re important to make projections of variables such as financial profits, raw material requirements or final demands [21]. In this sense, statistical modeling, mathematical data processing, and optimization approaches, become important aspects to consider for an appropriate control of the systems involved and to get adequate results.
Supply chain allows the use of model representations with many kind of structures, like stochastic formulation when a probability distribution for demand is known; then, using simulation for demand, adequate quantities to order and storage at minimum cost could be provided [7], [22], [23] but it is important to emphasize that models with constant terms are not enough to deal with the dynamics of the supply chain, in special, due to the bullwhip effect that is caused by high fluctuations of the demand, between a downstream and an upstream level, leading to possible mistakes in the ordering process or high inventories.
Trends, randomness, and variables with drastic changes are current facts in the supply chain, generating uncertainty in the decision making process; then, a model design must consider those changes for the respective fitting and prediction, but some models do not support such changing behavior, producing mistakes in the prediction process. Hence, some models estimate demand but not all of them are appropriately accurate.
Demand forecasting activities, inventory optimization, finance, management, marketing and digital contents require appropriate software to provide results for the decision-making process [24], [25]. That is the reason why the use of software plays an important role in the supply chain management, and in the transportation control or systems [17].
An adequate functioning of the supply chain management depends on a good connection between the production and the management of the supply systems [26]. This involves scheduling of the plant maintenance operations, coordinated planning of the production at a number of distinct geographical locations, and management of distribution and supply chains, that interacts strongly to obtain large benefits in terms of profitability and customer satisfaction. Supply chain management also supports good production results depending on its logistics operations, which involves of course, appropriate inventory levels in the hole chain, especially for perishable products, to provide a balance between requirements and inventory costs.
.
A set of optimization algorithms, including metaheuristics like Differential Evolution (DE), and Artificial Bee Colony (ABC), among others, were used in the design of an Artificial Neural Network to improve predictions of prices and demands [27], where the authors compared error measurements as RMSE and MAPE of the designed algorithm with other prediction models, finding a better result of their model.
These changes and fluctuations frustrate the estimation for long trend forecasting, affecting the performance of some models [28]. These problems in time series analysis for perishable products are also frequent in colombian firms, as it is considered in the application of this work, based on information collected from agribusiness companies. Thus, organizations contemplating inventory storage, often face dynamics where static inventory models are not enough to an adequate representation of their supply system. In this sense, literature shows models to forecast the demand under uncertainty, or randomness, and also, inventory models involving this randomness in some cases [12], [13]
These aspects justify the representation of the strong variations of the final demand, with correlation in inventory policies, for example, in forecasting models [12], [13], [29].
2) Demand forecasts. Different proposals consider the stochastic nature of the demand, first, because this variable is fundamental in the inventory optimization, and, second, due to the uncertainty in the decision making process, in special, with regard to costs, both, fixed and variable [30], and also, with respect to the client because bad predictions can lead to low inventory levels, and therefore, deficiencies in the customer service.
The stochastic demand formulation has been also one of the cases studied in the literature of inventory or production problems [22], [31], [32]. The models applied depend principally on the nature of the time series components, like trend, seasonality, randomness, autocorrelation, and stationary process, among others. Forecast precision could change as the components do, leading to errors that can be significant.
Innovative forecast models use, for example, bayesian techniques or combinatorial forecasts [33], neuronal networks [34], or fuzzy techniques [35]. A set of some forecasting models are summarized in the table 1.
Table 1: Summary of some forecasting models.

Source: Own elaboration.
c. Collaboration in the Industry
Collaboration “enables the integration and the global optimization of the supply chain” [17]. Among the most popular strategies are Vendor Management Inventory (VMI), Collaborative Planning, Forecasting and Replenishment (CPFR), besides of Forecast and Replenishment Collaborative (FRC ), according to [17].
Inventory collaboration requires an excellent traceability system, a clear and frequent communication, efforts directed to close the parts for coordination activities, and an alignment processes [10]. In this line, VMI is in fact, an integration with inventory-routing problem models, because in this, the supplier is responsible of the distribution, as well as the customer’s inventories [17], and it is one of the main strategies reflecting the integration. This trend of management could lead to generate savings of the inventory management, according to the authors of this paper.
Literature reflects this integration activities, as strategies for the decision making process, either than in isolated form, due to “increasing competitive pressure, shortened life-cycle products, rigorous quality and quicker response requirements” [46]. When decisions are taken in decentralized form, it is necessary to take care about the information shared, in order to produce an efficient organization of the supply chain. In the other side, the same author proved that collaborative planning helps with the maximization of expected profits, among the vendor and the retailer.
Implementation of these strategies lead to the need of technologies and software in the industry. In this direction, the Big Data Analytics techniques are tools to find meaningful insights from large volume of data [47], as key factors required to improve production, in special, for agro-industrial enterprises, supporting prices, clients, inventory, and quality management, among others [1], [48], that is the reason why these techniques are becoming mandatory for many agro-industrial SME’s [21]. This is an important aspect conforming all the processes of a recent industry trend, the digitalization, which requires computers, software, application packages, forecasting models, network, and infrastructure, among others aspects that can be used as Decision Support System tools to help in the decision making processes for the companies and sectorial clusters [21].
The literature review in this research shows relations among the technology required to Big Data Analytics and the logistic functions appropriated for agro-industrial companies in Colombia, especially in the agribusiness subsector.
Collaboration strategies are inherent to Operation Research, OR, and also pertinent to such subsector oriented to the management integration, aspects that also enable global optimization of this chain [17]. Many of these require technology, proper information systems, and quantitative models, among others, to interchange information in the supply chain operation [49], [50].
Competitiveness is a key requirement in the actual enterprise world. Association among enterprises could facilitate the collaboration and improve the competitiveness, involving different actors in a productive sector, because the dynamics and external factors influence and affect the sustainability; therefore, enterprises must compete as value chains, with a collaborative environment, not individually. Collaboration among industries, in aspects as information sharing, join efforts, and shared investments, would create trust and involvement that generate customer satisfaction and improve the performance of the companies.
Literature highlight benefits of collaboration in inventory planning, as service improvement, and costs, among others [10], [15], [32], [46], [51]. In the supply chain, collaboration among different parts can produce a total cost lower than the cost added from all the parts involved, or all the separated costs. It is also possible the profit maximization, as it is shown in [46] among different members of the construction sector, manufacturer, vendor and retailer, where an optimization model is proposed. Such successful initiatives need proper communication strategies, and systems with very good information flow, so that a business agreement can take place among the involved parts.
Other benefit is the inventory reduction, which influences directly the system operative costs and helps to provide a better customer service [10], in this concern, there are different works proposing models to the collaborative optimization, for example, using inventory coordination to calculate optimal quantities to the replenishment.
d. Hyphotesis
The basic research hypotheses in this study concern to the main relationships among the set of factors related to available technology, inventory models and collaboration in the inventory management for a colombian agribusiness subsector.
The main hypotheses are:
2.1 The available technology with Big Data Analytics impacts positively over collaboration in the inventory management and over the optimization management.
2.2 Inventory planning activities in the industry impacts positively over collaboration in the inventory management
2.3 Actions related to Big Data Analytics and its technologies increase integration and optimization.
The document presents a quantitative approach, with explicative and analytical emphasis, based on a survey instrument applied to a sample of 59 companies belonging to the agro-industrial subsector of the Departament of Antioquia, Colombia, in Medellín, and in the south and east of the region, with a simple random sampling, in the beginning of the year 2018, to obtain the observable variables required, building a database to estimate the Structural Equation Model the statistical model which enables a relation building.
In this research two hypothesis are tested applying two statistical models: A Poisson Regression Model, and a Structural Equation Modeling (SEM), as it is explained below.
a. Poisson Regression Model
When the response variable has a discrete nature, as a Poisson probabilistic distribution, a Poisson regression model can be useful to analyze relations and type of effects on this response of different co-variables. [52] have developed some comparative studies about their precision.
These models use a simple equation whit a link function for the response, ln(λ). This equation expresses the association between the discrete response and a set of co-variables x1, x2, … xk, with the form: ln(λ) = αX. Here λ is the vector of the mean response variables to estimate, α is the parameter vector, associated with the design matrix X, as it is shown in the equation (1).
![]()
Where ![]() is the ith effect of the co-variable i added to estimate an association with the average of activities to do collaboration,
is the ith effect of the co-variable i added to estimate an association with the average of activities to do collaboration,![]() .
.
b. Structural Equation Modelling (SEM)
The Structural Equation Model is a statistical technique, with a theoretical component based on multivariate analysis, correlation among variables, parameter estimation and significance tests. It requires the use of the observable variables obtained with the survey instrument for the companies. Then, a Structural Equation Model is formulated with the mentioned factors, and allows to determine the possible global significance, but also, probably association among latent variables.
Structural Equation Models (SEM) have been used in management, financial or also, social analysis, to evaluate student quality, tests performance [53]–[57], all of them verify some of the fitting and validation components. Here, different components are considered for the validation of the model estimation, for example, the validity tests: Chi square Test, which p-value should be under 0.05, and the Comparative Fit Index, CFI, should be high, between 0.8 and 0.9, although not many authors agree with the same quantities.
A Causal Path Diagram is a graphic representation of a Structure Equation Model [58], which includes the possible relations among latent and observable variables, using unidirectional and bidirectional arrows. Observable variables can be collected by survey instruments, applied by random sampling in the population units. Latent variables can be exogenous or endogenous, depending on the hypothesis. In this research, observable variables are represented in squares and latent ones in circles according to Fig. 1; the arrows show how a variable can affect or be affected by others, but if there is no line, there is no relation; this is an example of a Structural Equation Model represented by a path diagram, where the observable variables are denoted by xi, and yi, in rectangles, and the latent ones, by circles. The beta and gamma parameters correspond to the estimated effects by the model, and the covariance values, respectively.
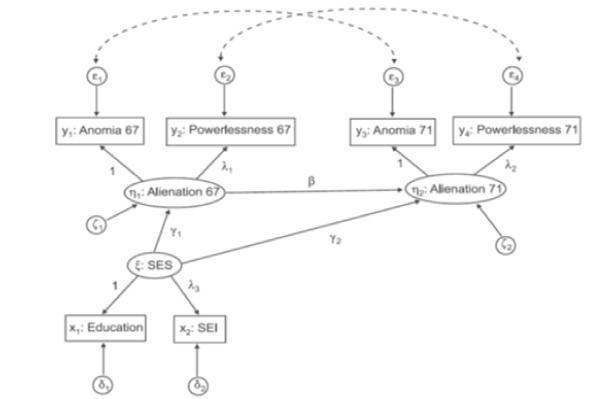
Figure 1: Example of a Diagram Path for a Structural equation model.
Source [61].
El process Estimation in SEM provides three kind of results: Confirmatory Factor Analysis, Regression Model and Covariance.
1) Confirmatory Factor Analysis relations. Permits to find significant observable variables to configure every endogenous or exogenous latent factors, by the association through single equations for every latent one, reducing the multidimensionality of all the observable variables.
Equation (2) represents latent variables for Available Technology, Models in the supply chain, and Optimization strategies. Equation (3) represents the principal latent variables in this research: Collaboration Strategies in Inventories and Control Inventory Politics.
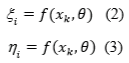
The Confirmatory Factor Analysis stablishes a function of observable variables, as the main incomes for latent variables, build from them ![]() . It generates the enough inputs to estimate regression models, analyzing the possible relations among the latent variables [59].
. It generates the enough inputs to estimate regression models, analyzing the possible relations among the latent variables [59].
2) Regression Relation. Regressions among latent variables allows detection of association among exogenous and endogenous variables, in order to test the previously proposed hypothesis.
Latent variables estimated by the Confirmatory Factor Analysis, CFA, conform the regression structure association, where the regression relation expresses the effects among the factors, and provides elements to set affirmative or negative hypothesis of the research. Equation (4) shows the representation with four latent variables.
![]()
The questionnaire instrument was applied to 59 organizations located in Antioquia, at the cities located in the Antioquia Deparment, in regions close to the Capital city Medellín, and the survey is divided in Wholesaler, producer, service provider and retailer of the agroindustrial sector (see table 2).
Table 2. Sample of companies.
Municipality |
Wholesaler |
Producer |
Service provider |
Retailer |
Organizations |
South of Capital |
3,7% |
74,1% |
18,5% |
3,7% |
27 |
Medellin |
0,0% |
84,6% |
15,4% |
0,0% |
26 |
East of Capital |
0,0% |
50,0% |
50,0% |
0,0% |
6 |
Total |
1,7% |
76,3% |
20,3% |
1,7% |
59 |
Source: Own elaboration.
Collaborative activities are determined and measured, in this study, as a response variable in a Poisson regression model estimation. Descriptive results show that 67% of the companies selected collaborative activities in their inventories, 33% do not.
c. Collaboration Levels
In first place, the number of integration activities related to collaboration and data sharing performance, was the response variable for a Poisson Regression Model estimation, related to the co-variables: the total activities related with technologies and big data analytics (including inventory control systems and software, forecasting, modeling, and material requirement planning, big Data indicators, analytics in optimization), and other covariable is the factor kind of company, that has three levels representing indicators variables, related to: producer, retailer or wholesaler.
Table 3: Poisson Regression Model.
| Coefficients: |
Estimate |
Std. error |
z value |
Pr(>|z|) |
|---|---|---|---|---|
Total Activities related to BigData |
0,1295 |
0,01182 |
10,953 |
< 2e-16 |
Wholesaler |
0,75655 |
0,17013 |
4,447 |
8,71E-06 |
Retailer |
0,3076 |
0,15363 |
2,002 |
0,0453 |
Producer |
0,47501 |
0,22319 |
2,128 |
0,0333 |
(Dispersion parameter for the Poisson family taken to be 1) |
||||
Source: Computed by the authors of this paper.
Result analysis of the Table 3. The first variable has a positive significant effect (0.1295), indicating that an increase of activities related to Technologies and Big Data Analytics also increase the strategies related to collaboration and integration. The kind of company has different effect to the response, so: the wholesalers have a higher effect (0.75655) which means that the collaboration occurs more frequently in these companies, followed by producers (0.47501) and finally by retailers (0.3076), in lower scale. These results are coherent to the percentages estimated after.
Table 4 shows percentages of companies by collaboration activities, regarding to an integration as a key of data interchange to improve operative results. Here, it refers to sharing information at every level, the higher amounts of qualifications assignments are for Collaboration in financial information, orders, Inventories, and time to product arrivals (last column), used in supply analysis; despite this, many of companies does not contribute to collaboration, because the second column shows high percentages of organizations with lowest points (0). Among the lowest indicators that these enterprises do not develop, are electronic commerce, information about sale points, and material requirements. Regarding to predictive models used for forecasting is not totally ignored; despite demand forecasting reflects that close to 51% of companies do not share such data, in the levels 3, 4 or 5, it reaches 45%, also, Inventories reaches 55% in 3, 4 o 5 level, it shows a trend to integrate other actors of their activities.
Table 4: Percentage of companies by collaboration degree.
TOPIC |
Lowest: 0 |
1 |
2 |
3 |
4 |
Highest: 5 |
Financial Information |
35,29 |
7,84 |
3,92 |
7,84 |
0 |
45,10 |
Orders |
43,14 |
3,92 |
1,96 |
1,96 |
9,80 |
39,22 |
Inventory |
37,25 |
3,92 |
3,92 |
15,69 |
0,00 |
39,22 |
Time to arrival |
49,02 |
3,92 |
1,96 |
3,92 |
3,92 |
37,25 |
Demand forecasting |
50,98 |
1,96 |
1,96 |
3,92 |
9,80 |
31,37 |
Prices |
43,14 |
11,76 |
1,96 |
3,92 |
7,84 |
31,37 |
Trends of market |
47,06 |
5,88 |
1,96 |
9,80 |
7,84 |
27,45 |
Promotion |
54,90 |
3,92 |
1,96 |
1,96 |
9,80 |
27,45 |
Material requirements |
50,98 |
3,92 |
1,96 |
5,88 |
15,69 |
21,57 |
Sale point |
60,78 |
3,92 |
1,96 |
3,92 |
7,84 |
21,57 |
Electronic Commerce |
76,47 |
3,92 |
1,96 |
7,84 |
0,00 |
9,80 |
Source: Computed by the authors of this paper.
d. Structural Equation Modeling
The Structural Equation Model (SEM) confirms the association among the latent variables of the hypothesis. Table 5 shows the effects of the observable and latent variables the summary of the SEM parameter estimation, where it is found an acceptable fit that it is significant and accounts for approximately 84% in the CFI in a general framework.
Table 5. Fitted measures.
Number of observations |
51 |
Minimum Function Test Statistic |
204,69 |
Degrees of freedom |
81 |
P-value (Chi-square) |
0 |
Model test baseline model: |
|
Minimum Function Test Statistic |
866,871 |
Degrees of freedom |
105 |
P-value |
0 |
User model versus baseline model: |
|
Comparative Fit Index (CFI) |
0,838 |
Tucker-Lewis Index (TLI) |
0,79 |
Root Mean Square Error of Approximation: |
|
RMSEA |
0,173 |
90 Percent Confidence Interval |
0,144 0,203 |
P-value RMSEA <= 0,05 |
0 |
Source: Computed by the authors of this paper.
Table 6 shows the estimation of effects of every observable variables for the latent dimensions which are the factors, denoted by “var…=~” and the last column shows the significance probability, and if this is lower than 5%, it is considered significant to explain the factor, if is higher, then the variable is eliminated and the model is re-estimated again. All the variables that remain in the model, are significant for every factors.
For example, for factor AT (Available technology), has all the observable variables significant, and the main effects are reflected are Material requirement plans, Big data indicator for operative controls, software for storage online.
Table 6: Effects of observable variables.
|
|
Denomination of variables |
Estimate |
Std. error |
z-value |
P(>|z|) |
|---|---|---|---|---|---|
AT =~ |
Factor: Avalilable Technology and Big Data |
|
|
|
|
ORDSOFT |
Software for orders |
1 |
|
|
|
CONTROLINV |
Control System for inventories |
1,508 |
0,437 |
3,454 |
0,001 |
STOREPROD |
Software for storage online |
1,752 |
0,65 |
2,695 |
0,007 |
MRP |
Material requirement plans |
3,888 |
1,505 |
2,584 |
0,01 |
BIG DATA SOFT |
Use of Software for inv and bigdata analytics |
0,42 |
0,148 |
2,843 |
0,004 |
BIG DATA INDICATOR |
Use of bigdata indicators for operative control |
2,034 |
0,711 |
2,86 |
0,004 |
IP =~ |
Factor: Inventory planning |
|
|
|
|
CONTROLINV |
Control System for inventories |
1 |
|
|
|
ORDSOFT |
Software for orders |
1,438 |
0,361 |
3,979 |
0 |
MODELOPTI |
Optimization Inventory model |
0,43 |
0,123 |
3,505 |
0 |
OPTINVEN |
Software to do Optimization Inventories-Analytics |
1,934 |
0,529 |
3,655 |
0 |
MRP |
Material requirement plans |
-2,17 |
0,905 |
-2,399 |
0,016 |
OM =~ |
Factor: Optimization Management |
|
|
|
|
OPTINVEN |
Software to do Optimization Inventories-Analytics in inventories |
1 |
|
|
|
PDISTRIB |
Distribution online planning |
3,432 |
1,106 |
3,103 |
0,002 |
DELIVOPT |
Analytics for optimal deliveries |
3,401 |
1,094 |
3,109 |
0,002 |
CIM =~ |
Factor: Collaboration inventory management |
|
|
|
|
COMPINVENT |
Storing data integration |
1 |
|
|
|
COMPRONOS |
Forecasting data sharing |
2,091 |
0,384 |
5,451 |
0 |
COMPLAND |
New products planning sharing |
2,293 |
0,421 |
5,442 |
0 |
COLLABORAT |
Sales and Inventory data integration |
0,216 |
0,089 |
2,418 |
0,016 |
DF =~ |
Factor: Demand |
|
|
|
|
DEMANDFORECAST |
Forecasting data sharing |
1 |
|
|
|
Source: Computed by the authors of this paper.
These estimations show that the available technology and Big Data activities are transversally, positively, and significantly related to systematization in the industry, digitalization, and also Optimization actions. For the inventory management, the most significant variable is the use of software to program orders, besides a control system for inventory levels and the existence of optimization models. In addition, collaboration reflects association with inventory sharing information, demand forecasting, and product planning. This integration implies an existence of support in the decision making processes by using the information flow, summaries, forecasts and statistics estimated among the actors of the agro-industrial chain.
The association found among observable variables as software and technology, models, inventories systematization, indicators control, and collaboration shows its effective use and applications at the supply chain management for this group of industries.
Hence, all this diversity of aspects in the industry could be part of the Big Data Analysis trends mentioned by different authors as [17] but despite the relations evidenced, not many industries in this agro-industrial sector use these tools to improve the supply chain management, as it was shown before.
Table 7: Regressions and covariance in the SEM model.
| Factor |
Estimate |
Std. Error |
z-value |
P(>|z|) |
|
|---|---|---|---|---|---|
CIM ~ |
Collaboration Inventory Management |
|
|
|
|
AT |
|
0,253 |
0,168 |
1,513 |
0,13 |
AT ~ |
Available technology and BD |
|
|
|
|
IP |
Inventory Planning |
0,547 |
0,293 |
1,868 |
0,062 |
CIM |
Collaboration |
0,263 |
0,125 |
2,103 |
0,035 |
DF ~ |
Demand Forecasting |
|
|
|
|
AT |
|
2,097 |
0,72 |
2,911 |
0,004 |
AT ~ |
Available technology |
|
|
|
|
OM |
Optimization Management |
0,579 |
0,205 |
2,828 |
0,005 |
Covariances: |
|
Estimate |
Std.Err |
z-value |
P(>|z|) |
IP ~~ |
Inventory Planning |
|
|
|
|
OM |
Operation Management |
0,169 |
0,109 |
1,545 |
0,122 |
Source: Computed by the authors of this paper.
Table 6 shows the parameter estimations, significative at 10%, indicating that there is a general association among technologies disponible and Big Data The CFI general indicator whit value of 84% of the explicated variation means that the association is consistent, so the final regression (Table 4) expresses that there is relation among Available Technology (AT) related to Big Data, with Collaboration Inventory Management (CIM), AT with Demand Forecasting (DF). The specific effects can be explained according to: AT associated with Big Data improves CIM; AT is also favorable with DF and with (OM) or Optimization management; IP and CIM are directed related to AT.
Thus, the SEM in the regression analysis expresses that the most important relations found are the incidence of the available technology to the collaboration in the inventory management and to inventory control politics, and also an inverse relation about collaboration affecting AT, reflecting the needs of the industries
The main result explains a positive significant effect relation meaning that an increase of activities related to Technologies and Big Data Analytics also increase the strategies related to collaboration and integration. Collaboration in Inventory Management has a bidirectional relation with the Available Technology and Big Data of the companies, but also, this last factor is definitely relevant to improve planning, collaboration and optimization, because collaboration impulses the adequate results of the chain management, it means that Big Data Analytics is transversal and important for those who provides Technology and integration in data and also search for good operative results at Inventory and Distribution activities; inventory planning and its proper analytics is inherent to the improvement of Available Technology. So these results indicate the necessity that many other companies make use of the technology to improve control systems, inventory planning and consequently, the supply chain management.
Collaboration in these companies shows a constant support in the information interchange that helps improving their performance, in especial, about inventory quantities. The association found among the latent variables including the collaborative strategies, reflects that Big Data Analytics is linked to the inventory management, pointing the importance to maintain the information interchange, but also, models, and optimization strategies to improve the management, supporting the decision making process for the best business performance as it has been analyzed by authors as [60] or [21].
A few small and medium-sized enterprises, SME´s, from the agro-industrial sector apply inventory modeling and optimization strategies, there is a trend to do collaborative strategies, despite it does not seem very high, but it reflects an integration as a key of data interchange to improve operative results and Big Data evidence. Some of the more developed variables associated to Big Data software and Analytics, are indicators for control, online data sharing of inventories, forecasting, Inventory Planning, and financial information sharing. It means that companies that use Big Data Analytics and its technology, integrate inventory information, finance, forecasts, storage systematization, materials and product planning, among others, and conduce to a positive effect to produce a general optimization.
Management of products with short-life cycles demands data sharing with fast movements and optimal results, to its adequate planning, production and supply. Hence it is a requirement to use proper digital media as well as the support in the modeling suitable for forecasts, or Big Data Analytics, adding inventory politics and collaborative strategies in order to the better supply chain management. The literature review showed the gaps and lacks in the small and medium-sized enterprises. The results of this study also reflects that increasing activities related to technology and Big Data Analytics reflects a better implementation of management strategies, based on collaborative activities as information sharing in inventories, order, prices and financial information to support the decision making process. In addition, according to the SEM model, all these aspects have significant association and thus, all are necessary to help in a proper management.
Digital technologies and Big Data Analytics become central activities and factors that support an adequate decision making process, facilitating the timely delivery of products, services and data, also promoting greater collaboration in order to accomplish for the customers’ satisfaction and goal achievement.
[1] A. Montoya, I. Montoya, and O. Castellanos, Situación de la competitividad de las Pyme en Colombia : elementos actuales y retos, Agron. Colomb., vol. 28, no. 1, pp. 107–117, 2010.
[2] M. D., Flores, R. M. Acosta, and R. G. Acolt, Estrategias y Retos en la incorporación de la Pequeña y Mediana Empresa al Comercio Internacional: un enfoque conceptual. RAN-Revista Academia & Negocios, Vol. 6, No., 1, 31-40. 2020.
[3] R. A. Goldberg, A concept of a global food system and its use by private and public manager,. Agribusiness, vol. 1, no. 1, pp. 5–23, 1985.
[4] A. Machado, De la Estructura Agraria al Sistema Agroindustrial. Universidad Nacional de Colombia, 2002.
[5] G. Behzadi, M. J. O’Sullivan, T. L. Olsen, and A. Zhang. Agribusiness supply chain risk management: A review of quantitative decision models. Omega (United Kingdom), vol. 79, pp. 21–42, 2018.
[6] D. F. Riedl, L. Kaufmann, C. Zimmermann, and J. L. Perols, Reducing uncertainty in supplier selection decisions: Antecedents and outcomes of procedural rationality. J. Oper. Manag., vol. 31, no. 1–2, pp. 24–36, Jan. 2013.
[7] H. Sarimveis, P. Patrinos, C. D. Tarantilis, and C. T. Kiranoudis, Dynamic modeling and control of supply chain systems: A review. Comput. Oper. Res., vol. 35, no. 11, pp. 3530–3561, Nov. 2008.
[8] F. Chahkoutahi and M. Khashei. A seasonal direct optimal hybrid model of computational intelligence and soft computing techniques for electricity load forecasting. Energy, vol. 140, pp. 988–1004, 2017.
[9] D. K. Barrow and N. Kourentzes, Distributions of forecasting errors of forecast combinations: Implications for inventory management. Int. J. Prod. Econ., vol. 177, pp. 24–33, 2016.
[10] M. D. Arango Serna, W. Adarme Jaimes, and J. a. Zapata Cortés, Inventarios Colaborativos En La Optimización De La Cadena De Suministros, Dyna, vol. 80, no. 181, pp. 71–80, 2013.
[11] R Core Team, R: A language and enviroment for statistical computing. R Foundation for Statistical Computing, Vienna, Austria., 2017.
[12] D. Simchi-Levi, P. Kaminski, and E. Simchi-Levi, Designing and Managing the Supply Chain, 3rd ed. New York: McGraw-Hill, 2008.
[13] M. Valencia, F. J. Díaz, and J. C. Correa, Planeación de inventarios con demanda dinámica . Una revisión del estado del arte, Revista DYNA, vol. 82, no. 190, pp. 182–191, 2015.
[14] M. M. Simanca, L. A. Montoya, and C. A. Bernal, Gestión del Conocimiento en Cadenas Productivas: El Caso de la Cadena Láctea en Colombia, Inf. tecnológica, vol. 27, no. 3, pp. 93–106, 2016.
[15] I. B. Suryaningrat, Raw Material Procurement on Agroindustrial Supply Chain Management: A Case Survey of Fruit Processing Industries in Indonesia, Agric. Agric. Sci. Procedia, vol. 9, pp. 253–257, 2016.
[16] S. Ahmedova, Factors for Increasing the Competitiveness of Small and Medium- Sized Enterprises (SMEs) in Bulgaria, Procedia - Soc. Behav. Sci., vol. 195, pp. 1104–1112, 2015.
[17] M. Grazia Speranza, Trends in transportation and logistics, Eur. J. Oper. Res., vol. 264, no. 3, pp. 830–836, Feb. 2018.
[18] G. Büyüközkan and F. Göçer, Digital Supply Chain: Literature review and a proposed framework for future research, Comput. Ind., vol. 97, pp. 157–177, 2018.
[19] D. Simchi-Levi, X. Chen, and J. Bramel, “The logic of logistics, Theory, Algorithms Appl. Logist. Supply Chain Manag. Second Ed. Springer, 2005.
[20] M., Papadimitrakis, et al. Metaheuristic search in smart grid: A review with emphasis on planning, scheduling and power flow optimization applications. Renewable and Sustainable Energy Reviews . Vol 145, 111072. 2021.
[21] S. Wolfert, L. Ge, C. Verdouw, and M. J. Bogaardt, Big Data in Smart Farming – A review,Agric. Syst., vol. 153, pp. 69–80, 2017.
[22] H. Arslan, S. C. Graves, and T. A. Roemer, A single-Product Multiple Inventory Model Demand Classes,vol. 53, no. 9, pp. 1486–1500, 2007.
[23] D. P. Morton and E. Popova, A Bayesian stochastic programming approach to an employee scheduling problem, IIE Trans., vol. 36, no. 2, pp. 155–167, Feb. 2004.
[24] A. Correa and R. Gómez, Tecnologías de la Información en la Cadena de Suministro, DYNA, vol. 76, no. 157, pp. 37–48, 2009.
[25] X. Lu, J. Song, and A. Regan, Inventory Approximate Updates : Planning with Forecast and Cost Error Bounds Solutions, vol. 54, no. 6, pp. 1079–1097, 2014.
[26]G. M. Kopanos, L. Puigjaner, and M. C. Georgiadis, Simultaneous production and logistics operations planning in semicontinuous food industries, Omega, vol. 40, no. 5, pp. 634–650, 2012.
[27] W. Puchalsky, G. Trierweiler, C. Pereira, R. Zanetti, and S. Coelho, Agribusiness time series forecasting using Wavelet neural networks and metaheuristic optimization: an analysis of the soybean sack price and perishable products demand, Int. J. Prod. Econ., vol. 203, no. June, pp. 174–189, 2018.
[28] M. Valencia-Cárdenas, F.. Díaz-Serna, and J. Correa-Morales, Multi-product inventory modeling with demand forecasting and Bayesian optimization, DYNA, vol. 83, no. 198, pp. 236–244, 2016.
[29] V. Gutiérrez and C. J. Vidal, Modelos de gestión de inventarios en cadenas de abastecimiento: Revisión de la literatura, Rev. Fac. Ing., vol. 43, pp. 134–149, 2008.
[30] T.-M. Choi, D. Li, and H. Yan, Optimal two-stage ordering policy with Bayesian information updating, J. Oper. Res. Soc., vol. 54, no. 8, pp. 846–859, Aug. 2003.
[31] U. W. Thonemann, Improving supply-chain performance by sharing advance demand information, Eur. J. Oper. Res., vol. 142, no. 1, pp. 81–107, Oct. 2002.
[32] L. Gao, Collaborative forecasting, inventory hedging and contract coordination in dynamic supply risk management, Eur. J. Oper. Res., vol. 245, no. 1, pp. 133–145, 2015.
[33] S., Huang, B., Ming, Q., Huang, G., Leng, and B., Hou. A case study on a combination NDVI forecasting model based on the entropy weight method. Water Resources Management, 31(11), 3667-3681. 2017.
[34] J. D. Velásquez, I. Dyner R, and R. C. Souza, Tendencies In The Prediction And Estimation Of The Confidence Intervals Using Models Of Neuronal Networks Applied To Temporary Series, DYNA - Fac. Minas la UNAL Medellín, vol. 73, no. 149, pp. 141–147, 2006.
[35] W. Gao, V. Sarlak, M. R. Parsaei, and M. Ferdosi, Combination of fuzzy based on a meta-heuristic algorithm to predict electricity price in an electricity markets, Chem. Eng. Res. Des., vol. 131, pp. 333–345, Mar. 2018.
[36] F. L. Chu, Using a logistic growth regression model to forecast the demand for tourism in Las Vegas, Tour. Manag. Perspect., vol. 12, pp. 62–67, 2014.
[37] F. Chahkoutahi and M. Khashei, A seasonal direct optimal hybrid model of computational intelligence and soft computing techniques for electricity load forecasting, Energy, vol. 140, pp. 988–1004, 2017.
[38] S. Wang, Exponential Smoothing for Forecasting and Bayesian Validation of Computer Models, no. December. 2006.
[39] B. Bowerman, A. Koehler, and R. O’Connell, Pronósticos, series de tiempo y regresión: un enfoque aplicado. México, DF:. CENCAGE Learning, 2007.
[40] F. Zhang, C. Deb, S. E. Lee, J. Yang, and K. W. Shah, Time series forecasting for building energy consumption using weighted Support Vector Regression with differential evolution optimization technique, Energy Build., vol. 126, pp. 94–103, 2016.
[41] B. West, K. Welch, and A. Galecki, Linear mixed models A practical guide using Statistical Software, Taylor and. 2007.
[42] W. Gao, V. Sarlak, M. R. Parsaei, and M. Ferdosi, Combination of fuzzy based on a meta-heuristic algorithm to predict electricity price in an electricity markets, Chem. Eng. Res. Des., vol. 131, pp. 333–345, 2018.
[43] V., Dorie, and M. V., Dorie, Package ‘blme’. Bayesian Linear Mixed-Effects Models. URL https://CRAN. R-project. org/package= blme. pp. 1–8, 2015.
[44] G. Petris, S. Petrone, and P. Campagnoli, Dynamic Linear Models with R. 2009.
[45] G. Petris, An R Package for Dynamic Linear Models, J. Stat. Softw., vol. 36, no. 12, pp. 1–16, 2010.
[46] S. S. Sana, A collaborating inventory model in a supply chain, Econ. Model., vol. 29, no. 5, pp. 2016–2023, 2012.
[47] V. Gružauskas, S. Baskutis, and V. Navickas, Minimizing the trade-off between sustainability and cost effective performance by using autonomous vehicles, J. Clean. Prod., vol. 184, pp. 709–717, 2018.
[48] L. Camanzi, E. Arba, C. Rota, C. Zanasi, and G. Malorgio, A structural equation modeling analysis of relational governance and economic performance in agri-food supply chains: evidence from the dairy sheep industry in Sardinia (Italy), Agric. Food Econ., vol. 6, no. 1, 2018.
[49] O. Palacio and W. Adarme, Coordinación de inventarios : Un caso de estudio para la logística de ciudad, DYNA - Fac. Minas la UNAL Medellín, vol. 81, no. 186, pp. 295–303, 2014.
[50] M. Arango-Serna, W. Adarme-Jaimes, and J. Zapata-Cortes, Collaborative inventory in supply chain optimization, no. Vmi, pp. 71–80, 2013.
[51] T. Willems and A. Marrewijk, Building Collaboration? Co-Location and ‘Dis-Location’ in a Railway Control Post, Rev. Adm. Empres., vol. 57, no. 6, pp. 542–554, 2017.
[52] C. W. S. Chen and S. Lee, Generalized Poisson autoregressive models for time series of counts, Comput. Stat. Data Anal., vol. 99, pp. 51–67, 2016.
[53] Y. Rosseel, lavaan: An R package for structural equation modeling, J. Stat. Softw., vol. 48, no. 2, pp. 1–36, 2012.
[54] M. T. Escobedo Portillo, J. A. Hernández Gómez, V. Estebané Ortega, and G. Martínez Moreno, Modelos de ecuaciones estructurales: Características, fases, construcción, aplicación y resultados, Cienc. Trab., vol. 18, no. 55, pp. 16–22, 2016.
[55] M. Nakano, Collaborative forecasting and planning in supply chains: The impact on performance in Japanese manufacturers, Int. J. Phys. Distrib. Logist. Manag., 2009.
[56] Y. Nuñez and C. Rodriguez, Gestión de recursos intangibles en instituciones de educación superior, Rev. Adm. Empres., vol. 55, no. 1, pp. 65–77, 2015.
[57] S. R. Cabana, F. H. Cortés, D. L. Vega, and R. A. Cortés, Análisis de la fidelización del estudiante de ingeniería con su centro de educación superior: Desafíos de gestión educacional, Form. Univ., vol. 9, no. 6, pp. 93–104, 2016.
[58] T. Raykov and G. a. Marcoulides, A First Course in Structural Equation Modeling, vol. 13, no. 1. 2006.
[59] Y. Rosseel, lavaan: An R Package for Structural Equation Modeling, J. Stat. Softw., vol. 48, no. 2, pp. 1–36, 2012.
[60] T. Ojha, S. Misra, and N. S. Raghuwanshi, Wireless sensor networks for agriculture: The state-of-the-art in practice and future challenges, Comput. Electron. Agric., vol. 118, pp. 66–84, 2015.
[61] J. Fox. Structural Equation Modeling With the sem Package in R. Structural Equation Modeling, Vol 13, No 3, 465–486. http://doi.org/10.1207/s15328007sem1303_7. 2006.