
http://dx.doi.org/10.15649/2346030X.919
Design of a Resilient and Eco-friendly Microgrid for a Commercial Building.
Sergio Sepúlveda-Mora1
Steven Hegedus2
- Universidad Francisco de Paula Santander, Cúcuta - Colombia. E-mail: sergio.sepulveda@ufps.edu.co Autor de correspondencia
- University od Delaware, Delaware - United States.
Received: October 19th, 2020.
Accepted: December 18th, 2020.
Published: January 1th, 2021.
Atribución 4.0 Internacional (CC BY 4.0)
Abstract— Recent natural disasters such as hurricanes Harvey and Maria have caused great disruption to the electric grid system. Additionally, government authorities have set ambitious goals to reduce greenhouse gas emissions. Thus, there is a growing interest in making the electric power systems more resilient while reducing their carbon footprint. In this work, a methodology to design a resilient and eco-friendly microgrid is presented. First, the input parameters of the model are defined; second, simulation of different microgrid configurations are performed in HOMER Grid software; third, the outputs of the model are analyzed; and finally, a microgrid configuration is selected based on economic, environmental, and resilience criteria. The considered microgrids consist of PV, battery, natural gas generator, and the electric load of an office building that consumes an average of 2 MWh per day. Different component sizes were used to determine the configuration with the lowest generator size to provide power during a two-day outage in the summer peak load. Environmental and economic analysis were performed to show the tradeoffs between different system design goals. The results indicate that installing a microgrid in an office building with a 600 kW PV array and 2.8 MWh lithium-ion battery can avoid the release of up to 287 tons of CO2 per year. The same microgrid configuration can endure a two-day blackout during the highest electric demand in the hurricane season without the need of a polluting backup generator. From this study, it was concluded that the optimal microgrid configuration depends on specific needs. Additionally, based on current technology costs, large PV systems with small batteries are economically more attractive than the base case configuration.
Keywords: Environmental analysis; Homer Grid; Microgrid; PV + battery; Resilience.
The conventional electric grid is highly vulnerable to natural disasters. For instance, an earthquake and subsequent tsunami in 2011 caused a massive blackout to more than 8 million customers in Japan [1]. Superstorm Sandy made landfall in the east coast of the United States in 2012, causing great damage to the electric infrastructure and floodings with long-term negative effects [2]. Storm Desmond led to a blackout in 2015 that affected more than 100,000 people in Lancaster, United Kingdom [3]. More recently, hurricane Maria had devastated effects on the transmission and distribution networks of Puerto Rico that affected the entire island and produced power outages that lasted more than 10 months [4].
After the Paris Agreement in 2015, many government authorities have set ambitious goals to reduce green house emissions [5]. According to the U.S. Environmental Protection Energy, 32 % of the CO2 emissions of the U.S. in 2018 were emitted from generating electricity [6]. Therefore, there is a need for cleaner and resilient electric power systems. To achieve this goal, several authors have performed resilience analysis of electric power systems using simulation tools to examine how microgrids with different components can power the electric load during a blackout.
One of the most popular simulation tools available for resilience analysis is the Renewable Energy Optimization (REopt) developed by the U.S. National Renewable Energy Laboratory. The authors in [7] used REopt to model random outages in a building in New York with photovoltaic array (PV) and Battery Energy Storage (BES). In a similar study, the authors calculated the probability that a microgrid with PV, BES, and diesel generator can survive a random outage of up to 14 days in California [8] and up to 9 days in a hospital in New York [9] using REopt. In [10], the authors employed the same software and energy resources, but considered a school, office, and hotel as the electric loads, power outages of 2 h occurring every hour, and a critical load of 50 % of the regular load. In [11] the same microgrid configuration was studied in REopt for a Hospital with power outage durations of 8 h, 16 h, and 24 h in the summer and winter solstices. Using REopt, the authors in [12] examined the effect of random outages lasting from 0 to 14 days in an office building in California with PV and BES.
HOMER Pro is another simulation tool commonly used for resilience studies. Authors reporting the use of this software to conduct resilience assessments include the following. The authors in [13] simulated 2-day power outage on september for a clinic in Iran comparing a system with gasoline generator and a system with PV + BES. In [14] a microgrid with PV, BES, wind and diesel generator (DG) was modeled for industrial parks in Ethiopia considering random outages of 1-2 h. The study reported in [15] investigated the effect of outages with durations of 1 h, 4 h, 2 days, and 5 days on a community center in Tanzania having PV + BES + DG. The authors in [16] analyzed a system with PV + BES with a daily 6 h outage in a household located in Pakistan. In [17], short and frequent (2 h, 1800 times per year) power outages were simulated in a household in Iraq with PV + BES. In [18], the authors studied a residential load with PV + BES + DG having a 9 h power outage every day. Finally, the author in [19] evaluated the cost of outages with a duration of 1 h and a frequency of 260 times per year in a glass factory in India, and the added resilience value of a microgrid with PV + BES + DG.
In this work, we used HOMER Grid software to conduct an economic, environmental and resilience analysis of microgrids with multiple energy resources including photovoltaic arrays, lithium-ion batteries, and natural gas generators to power an office building in Wilmington, Delaware, USA. As HOMER Pro, HOMER Grid is developed by HOMER Energy LLC. However, HOMER Pro is designed for off-grid applications while HOMER Grid is intended to model behind-the-meter microgrids with distributed generation resources and peak shaving capabilities.
The rest of this paper is organized as follows. Section II introduces some fundamental concepts; section III provides details about the simulation inputs and procedures; section IV shows the results from three different aspects (economic feasibility, environmental impact, and resiliency); in section V we select the microgrid configuration that better fits all the design criteria; section VI describes the conclusions of this study; and finally, section VII elucidates some ideas for future work.
a) Microgrids
A microgrid is a collection of interconnected distributed energy resources and electric loads that are located inside clearly defined geographical boundaries, and act as a single controllable entity. They can operate connected to the grid, or in island mode [20]. The energy resources can be generation assets (PV, wind turbines, fuel cells, fossil fuel generators, etc.) or energy storage (batteries, flywheels, super capacitors, etc.), and the loads can be fixed, flexible or deferrable [21]. Due to the multiple energy sources, microgrids offer more reliable and resilient power than conventional power systems. The energy storage component gives the microgrid the ability to provide ancillary services to the electric grid and to enable a high penetration of renewable energy; microgrids are considered the building block of the future smart grid [22].
b) Demand charges and peak shaving
Commercial customers in the United States have a three-component electric tariff: fixed, volumetric energy cost, and demand charge. The fixed charge reflects the cost of billing, metering, and customer service. The energy cost is proportional to the amount of electricity a customer consumes each month. The demand charge is typically based on peak electricity consumption over a span of 15, 30, or 60 min [23]. Generally, demand charge corresponds to the highest 15-min average usage within a given month.
Demand charges encourage the users to reduce power usage during peak hours and to shift their usage from peak to non-peak hours. Demand charge varies from utility to utility in the U.S., and sometimes is different for customers of the same utility but located in different jurisdictions [24].
Energy storage can be used to reduce demand charges. When the energy usage of the customer is high, the battery can supply a fraction of the electricity reducing the peak demand. When consumption is low, electricity from the grid or other energy source can recharge the battery. This process is called peak shaving or demand charge reduction, and it helps to decrease the total electric bill [25].
The combined use of photovoltaic arrays (PV) and battery energy storage (BES) to minimize the demand charges and reduce the overall cost of the system has been widely investigated in the literature [26]–[35].
c) Net present cost
The Net Present Cost (NPC) is the total cost of the entire system over its lifetime, subtracting revenues and considering the time value of money. The NPC is also known as life-cycle cost and it considers capital, replacement, fuel, and operation & maintenance (O&M) costs [36]. The NPC is equivalent to the negative of the Net Present Value (NPV). This metric is commonly used to evaluate projects from a financial perspective, where the lowest NPC is usually the best alternative.
d) Levelized Cost of Energy
The Levelized Cost of Energy (LCOE) is the average cost per unit of energy (typically kWh) of useful electrical energy produced by a power energy system [36]. It considers the total costs incurred during the lifetime of the project, and the energy produced by all the energy sources during their lifetime.
e) Resiliency
Resiliency is the ability to withstand, absorb, adapt, and recover from a disruption. A resilient power system is capable of endure turbulence and continue to provide energy services to subscribers. It can also recuperate quickly from disturbance and have contingency plans for meeting energy service requirements [37].
In order to design a resilient and eco-friendly microgrid, we propose the 4-stage process shown in figure 1. First, the input parameters for the model are defined. These inputs include the tariff structure of the electric grid, the type of load profile, the capacity of the distributed energy resources (PV array, generator, and battery), the characteristics of the power outages, and the economic parameters.
In the second stage, we set up and run the simulation of all microgrid configurations that were defined in the first step. Then, stage 3 involves exploration and analysis of the results. The last stage consists in choosing the optimal microgrid configuration based on a good balance between economic, environmental, and resilience aspects.
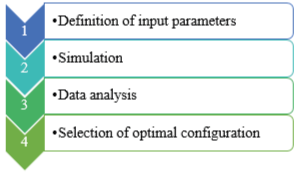
Figure 1: Methodologic design.
Source: Own elaboration.
We considered two scenarios: an emergency mode with a 2-day outage during the summer peak load, and normal operation mode with no outages. Figure 2 shows the microgrid architecture used in the simulations. The electric load, the PV array, the generator, and the electric grid are connected to the AC bus, while the battery is connected to the DC bus. The bi-directional converter links the DC bus and the AC bus allowing the battery to charge from either the Grid or the PV array; in the opposite power flow, the converter also allows the battery to power the load.
HOMER Grid software [38] (version 1.7.4) with academic license was used to run all the simulations reported in this work. A discount rate of 6 %, inflation of 2 %, project lifetime of 25 years, and the Investment Tax Credit of 26 % for solar only were the economic inputs for the modeling.
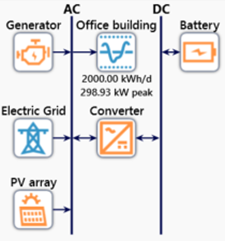
Figure 2: Microgrid architecture.
Source: from HOMER Grid software.
a) Electric Grid
The electric tariff from the utility consists of three components, namely, a flate rate for energy consumption, demand charge and a fixed charge. We used typical values for commercial loads in the state of Delaware [39] which are presented in table 1.
Tariff component |
Value |
Energy consumption |
12 ¢/kWh |
Demand |
$12/kW |
Fixed |
$185 |
Source: U.S. Energy Information Administration [39].
Electricity in the State of Delaware is generated mainly from natural gas-fired power plants [40]. The U.S. Energy Information Administration publishes estimates of the emissions in the electric grid by state. The values corresponding to Delaware were used as inputs in the model to account for the environmental impact of the microgrids (see Table 2).
Table 2: Emissions from the electric grid in Delaware.
Pollutant |
Value (g/kWh) |
Carbon dioxide (CO2) |
510.74 |
Sulfur dioxide (SO2) |
0.09 |
Nitrogen Oxides (NOx) |
0.27 |
Source: U.S. Energy Information Administration [41].
b) Load profile
The Office of Energy Efficiency & Renewable Energy from the U.S. Department of Energy created a database of hourly load profiles for 16 commercial reference buildings in different climate zones within the United States [42]. The raw data can be found in [43]. For this study, we selected a medium-size office building in Wilmington, Delaware with an average daily energy consumption of 2 MWh.
Figure 3 shows two different representations of the load profile. The seasonal variability and the weekly patterns can be observed in the time series (Figure 3a). Winter peaks are considerable higher than summer peaks, which probably implies the use of electric heating. Additionally, the low activity during the weekends in an office building is evident from the low energy demand in Figure 3a. On the other hand, Figure 3b is the load duration curve, which contains the same data as Figure 3a, but sorted in descending order. This type of plot is useful to identify the number of hours that the load requires certain amount of power. For instance, there are only 61 hours during the year when the load consumes more than 200 kW. In other words, 99 % of the time, the load requires 200 kW or less power. This is consistent with figure 3a, where a few bursts of peak power can be seen during the winter months. Another insight from the load duration curve is that 50 % of the time, the load needs 76 kW or less power.
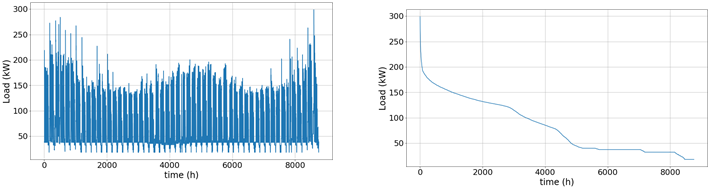
(a) (b)
Figure 3: Description of the load profile as (a) time series, and (b) load duration curve.
Source: Own elaboration.
c) PV array and energy storage
To model the PV array, we used Helioscope software [44] to estimate the energy production of a solar carport located in Delaware. Increasingly, commercial facilities are putting solar arrays over their parking lots, so we decided to utilize that solar capacity in the microgrid. This avoids area limitation of a rooftop installation. Helioscope is specialized in PV system analysis, and the power output was used as input in the model. PV production was imported from Helioscope and scaled to simulate four PV sizes, corresponding to 100 %, 75 %, 50 % and 25 % of the total annual energy consumption of the load. Table 3 displays the capacity of the PV arrays.
Table 3: Capacity of PV arrays.
PV capacity (kW) |
Percentage of anual load |
150 |
25 % |
300 |
50 % |
450 |
75 % |
600 |
100 % |
Source: Own elaboration.
Energy storage was included using the generic lithium-ion (Li-ion) battery component with the Advanced Storage Model, which is based on the Modified Kinetic Battery Model. This model considers temperature effects on capacity and degradation rate, and cycle-by-cycle degradation based on depth of discharge; a detailed description of the model is available in [45].
In this analysis, we considered battery sizes that could power the average load from 3 h to 24 h with increments of 3 h (see Table 4). We use the term ‘autonomy’ to represent the amount of time the usable capacity of the battery can sustain the average load. The minimum state of charge, the degradation limit, and the round-trip efficiency were set at 20 %, 30 %, and 90 %, respectively.
Table 4: Capacity of li-ion batteries.
Battery capacity (kWh) |
Autonomy (hours) |
350 |
3 |
700 |
6 |
1050 |
9 |
1400 |
12 |
1750 |
15 |
2100 |
18 |
2450 |
21 |
2800 |
24 |
Source: Own elaboration.
Capital, replacement, and Operation & Maintenance costs for PV and batteries were provided by the software tool, which keeps updated prices based on commercial average cost estimations reported by Bloomberg New Energy Finance (BNEF) [46], the National Renewable Energy Laboratory (NREL) [47], [48], and the Lazard’s Levelized Cost of Storage (LCOS) analysis [49].
To interface the DC and AC buses, a generic large converter component was selected. We assumed that the cost of the DC/AC converter was included in the battery components as the power conversion system (rectifier/inverter).
d) Generator and power outages
A backup natural gas generator was used in the model to provide reliability during the power outage. Four sizes were considered:
25 %, 50 %, 75 %, and 100 % of the summer peak load. Although the winter peak load is higher (Figure 3a), the summer peak was selected because a hurricane in the east coast is more likely to take place during summer. The capacity of the generators that were considered in the simulations are shown in table 5. The generator has a minimum load ratio of 25 %, lifetime of 15,000 h, and only operates during the outage.
The highest power demand in the summer occurs on July 13th at 3:00 pm. Therefore, we set up the outage to start on July 12th at 3:00 pm with a duration of 2 days. The critical load was assumed to be 100 % of the normal load, meaning that during the outage, the microgrid must supply energy to meet the entire load.
Table 5: Capacity of backup generators.
Generator capacity (kW) |
Percentage of summer peak load |
50 |
25 % |
100 |
50 % |
150 |
75 % |
200 |
100 % |
Source: Own elaboration.
The 2-day power outage represents a high-impact low-probability event whose frecuency was adjusted to every 15 years. Additionally, since most hurricanes are predictable from weather forecast, we assumed that the dispatch algorithm has advance knowledge of the outage.
e) Microgrid controller
The model includes a peak shaving dispatch algorithm that acts as the brain of the microgrid, making decisions in each time step on how to distribute and balance the power flow. The controller has two main goals: 1) meet the electric load using the energy resources (PV, grid, battery, generator) and 2) reduce the demand charges. At each time step, the algorithm decides how to dispatch energy from every resource by looking 48 h ahead of time (load and PV production).
For the normal operation scenario (no generator and no outages), we simulated 45 microgrid configurations with all the possible combinations of PV arrays and battery sizes, including no battery and no PV. In emergency mode, we considered 225 microgrid configurations, but we disregarded the ones that did not meet the load during the outage; for example, all the systems with no generator and no battery could not power the load over the outage, even with a large PV array, because there is no energy source available at night. In total, there were 166 feasible solutions in the emergency mode scenario.
The remaining parts of this section provide an analysis of the results from three different perspectives, namely, the economic aspect, the environmental impact, and finally, the resilience assessment.
a) Economic analysis
The values of the Net Present Cost (NPC) of each microgrid configuration for both scenarios are depicted in Figure 4. The minimum NPC for the two scenarios corresponds to the system with no battery and 100 % PV. In contrast, the microgrid with the largest battery (24 h) and no PV has the maximum NPC in both cases.
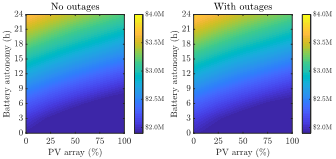
Figure 4: Net present cost of different Microgrid configurations (a) without generator or outages, and (b) with a 200 kW generator and 2-day outages
Source: Own elaboration.
The diagonal pattern in Figure 4 reveals that systems with large PV arrays and medium or large batteries have an NPC value similar to microgrids with significantly lower PV arrays and batteries, e.g. a microgrid with 100 % PV and 12 h battery has a NPC comparable to a microgrid with no PV and 6 h battery.
As a reference point, we consider the baseline configuration, for either scenario, the system with no PV and no battery. In emergency mode, the baseline includes a 200 kW backup generator. From Figure 4, most of the configurations have an NPC greater than the baseline. All the systems with any PV size and a small (3 h) or no battery have lower NPC than the baseline. Likewise, microgrids with large PV (≥ 75 %) and 6 h battery are also a better economic alternative than the baseline.
Comparing the NPC of normal mode and emergency mode in Figure 4, the difference is subtle. The scenario with outages has slightly higher NPC values due to the addition of the generator, but the cost of that component is small compared to the whole system. From en economic and technical point of view, the systems that include the generator are preferable; not only the NPC is similar to the counterpart without the backup generator, but they also provide higher reliability than relying on PV energy only that has an intermittent nature.
The values of the Levelized Cost of Energy (LCOE) for each microgrid configuration in emergency mode are presented in
Figure 5. General trends of the LCOE resemble the NPC behaviour from Figure 4. However, the system with 100 % PV and 12 h battery has a lower LCOE than the baseline, as opposed to the NPC results.
The highest LCOE ($0.33/kWh) corresponds to the largest battery with no PV and is almost twice the LCOE of the baseline ($0.17/kWh). On the other hand, the microgrid configuration with the largest PV array and no battery has the lowest LCOE ($0.08), which is about half of the baseline ($0.17/kWh).

Figure 5: Levelized Cost of Energy (LCOE) of different microgrid configurations with a 200 kW backup generator (emergency mode scenario). Values are in $/kWh.
Source: Own elaboration.
The difference in LCOE between the emergency mode and normal operation mode scenarios is negligible. In the calculation of LCOE, the model factors in all the costs during the 25 years of the system, and all the energy produced by the microgrid generation resources. Therefore, the generator, that is used only 48 h every 15 years, has a minuscule impact on this metric.
b) Environmental analysis
The baseline configuration in emergency mode releases 373 metric tons of carbon dioxide per year, which come mostly from the energy purchased from the grid, and in a very small fraction from running the backup generator during the power outage. Figure 6 is a 3D plot of the annual CO2 emissions as a function of PV and battery size for the emergency mode scenario.
Adding batteries with no PV increases CO2 emissions. The microgrid with the largest battery (24 h) and no PV produces 4 % more emissions than the baseline configuration. This can be explained because the energy dispatch algorithm decides to buy more energy from the grid to store in the batteries with the goal of reducing demand charges.
Small PV systems (≤ 50 %) greatly reduce emissions. As the PV array increases, the effect is smaller, especially with no battery. This is due to the need to buy energy from the grid at night when the sun is not shining. For microgrids with large PV arrays, excess electricity can be used to charge the batteries, which can be discharged at night to power the load, avoiding grid purchases, and reducing emissions. However, this effect decreases as the battery gets bigger, and it saturates at batteries with 18 h of autonomy.

Figure 6: Annual carbon dioxide emissions for the emergency mode scenario.
Source: Own elaboration.
As expected, the maximum reduction in CO2 emissions corresponds to the microgrid with the largest PV array (100 %) and the largest battery (24 h). This configuration prevents the release of 287 tons of CO2 which represents a 77 % reduction compared to the baseline microgrid configuration. Over the lifetime of this microgrid, 7,174 tons of CO2 can be avoided.
c) Resilience analysis
Figure 7 shows the minimum generator size that can sustain the load during the power outage as a function of PV and battery size. The largest battery with no PV can reduce the generator size in half because the energy capacity is 24 h, which is half the outage duration. In contrast, even the largest PV array without battery can reduce the generator size only by 25 % because the generator is the only energy source at night.
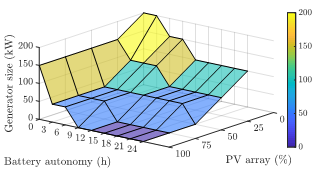
Figure 7. Minimum generator size to meet the load during a two-day outage.
Source: Own elaboration.
A microgrid with 100 % PV and 9 h battery or larger can survive the power outage without a generator. Alternatively, a 75 % PV with a battery autonomy of 12 h or larger can provide power to the load during the 48 hour blackout with no backup generator. These configurations achieve the required level of resiliency using renewable energy resources only.
The energy dispatch during the power outage for three cases is displayed in Figure 8. First (Figure 8a), the baseline is considered; second (Figure 8b), a microgrid with large PV (75 %), small battery (6 h), and a small generator (50 kW) is presented. The third case (Figure 8c) is a 100 % renewable energy microgrid, with no generator.
For the baseline configuration (Figure 8a), the generator turns on and follows the load when the outage starts. At night, when the load is low, the generator needs to run at least at 25 % of its nameplate capacity (due to the minimum load ratio) even if this is greater than the load. This excess energy must be shunted to a dummy load.
According to Figure 8b, the microgrid with a combination of 75 % PV, 6 h battery and 50 kW generator uses all the energy resources to endure the outage. The battery undergoes two full cycles thanks to the excess PV electricity. At the beginning of the blackout, the load is met by PV and the battery. The generator turns on at night when there is no solar energy and the battery State of Charge (SoC) is low. Then, early in the morning, PV energy is large enough to meet the load and charge the battery. A similar process happens in the second day of the outage.
Similar to the previous case, the PV array and the battery power the load when the outage starts as seen in Figure 8c. At night, the battery takes over and powers the load continuosly until the morning of the next day. Then, the PV array provides energy to the load and recharges the battery fully. When PV fades out, the battery discharges and powers the load until next day when PV is back on and repeats the process. The change in the slope of the battery SoC indicates that the battery discharges at a high rate when the load is high during the day, and at a lower rate when the load is low at night.

Figure 8: Energy dispatch during the outage for (a) 200 kW generator only, (b) 75 % PV, 6h battery and 50 kW generator, and (c) 100 % PV, 9h battery and no generator.
Source: Own elaboration.
In this work, we analyzed multiple microgrid configurations for a medium-sized office building in Wilmington, Delaware, USA. The best design option depends on the target goal. From the economic point of view, a microgrid with 100 % PV with no battery and no generator has the minimum net present cost. From the environmental impact, the best option is a microgrid with 100 % PV and 24 h battery. Finally, from the resilience perspective, there are several feasible solutions, including the baseline with a 200 kW generator, and various combinations of large PV arrays with large batteries.
Considering a holistic approach, we suggest the implementation of a microgrid with 75 % PV, 6 h battery, and a 200 kW generator based on the following claims. From the economic perspective, this system has a lower NPC and LCOE than the baseline. Regarding the environmental impact, the proposed microgrid reduces the CO2 emissions by 60 %, avoiding the release of 225 tons of CO2 per year compared to the baseline configuration. Finally, the large generator, relatively large PV array, and the 6 h battery provide a high level of resiliency, even under unfavorable weather conditions. We selected the 75 % PV over the 100 % PV, because the net metering regulation in the United States prevents users from exporting to the grid more electric energy than the consume over the course of one year.
The implementation of microgrids to power commercial loads can benefit the end user from an economic, environmental, and resilience points of view. Based on the specific needs, the optimal microgrid configuration could be different. Considering a multi-criteria approach, we propose that a microgrid with a PV array of 450 kW, a li-ion battery capacity of 700 kWh, and a backup natural gas generator with nameplate capacity of 200 kW provides the most benefits for a medium-sized office building in Wilmington, DE, USA.
With current technology costs, large PV systems with small batteries are economically more attractive than the baseline configuration (load connected to the grid). If resilience is a concern for the end user, a microgrid with multiple energy resources is the best option to guarantee reliable, clean power to avoid interruptions caused by natural disasters or man-made events.
Microgrids will play a key role in the transition to a descentralized, modern and cleaner grid for the future. They provide reliable power, make the system more grid-failure tolerant, and allow a high penetration of renewable energy into the electric grid which consequently reduces the carbon footprint.
To complement this work, we recommend trying out dispatch algorithms with different goals. The software tool allows the implementation of custom dispatch strategies by integrating a customized algorithm using Matlab software. Another suggestion is the use of more complex tariff structures in the analysis, such as time-of-use rates or real-time pricing. Finally, the incorporation of demand-response programs and Electric Vehicles as electric loads is possible with the latest version of HOMER Grid. These features can help to explore other value streams of microgrids for commercial customers.
[1] H. Aki, “Demand-Side Resiliency and Electricity Continuity: Experiences and Lessons Learned in Japan,” Proc. IEEE, vol. 105, no. 7, pp. 1443–1455, 2017.
[2] D. Yates et al., “Stormy Weather. Assessing Climate Change Hazards to Electric Power Infrastructure: A Sandy Case Study,” IEEE Power & Energy Magazine, vol. 12, no. 5, pp. 66–75, 2014.
[3] R. Kemp, “Electrical system resilience: A forensic analysis of the blackout in Lancaster, UK,” Proc. Inst. Civ. Eng. Forensic Eng., vol. 170, no. 2, pp. 100–109, 2017.
[4] A. Kwasinski, F. Andrade, M. J. Castro-Sitiriche, and E. O’Neill-Carrillo, “Hurricane Maria Effects on Puerto Rico Electric Power Infrastructure,” IEEE Power Energy Technol. Syst. J., vol. 6, no. 1, pp. 85–94, 2019.
[5] X. Pan, M. den Elzen, N. Höhne, F. Teng, and L. Wang, “Exploring fair and ambitious mitigation contributions under the Paris Agreement goals,” Environ. Sci. Policy, vol. 74, pp. 49–56, 2017.
[6] Unites States Environmental Protection Agency, “Overview of Greenhouse Gases,” 2020. [Online]. Available: https://www.epa.gov/ghgemissions/overview-greenhouse-gases. [Accessed: 04-Sep-2020].
[7] T. Simpkins, K. Anderson, D. Cutler, and D. Olis, “Optimal sizing of a solar-plus-storage system for utility bill savings and resiliency benefits,” in IEEE Power and Energy Society Innovative Smart Grid Technologies Conference (ISGT), 2016, pp. 1–5“Optimal sizing of a solar-plus-storage system for utility bill savings and resiliency benefits,” in IEEE Power and Energy Society Innovative Smart Grid Technologies Conference (ISGT), Minneapolis, MN: IEEE, 2016, pp. 1–5.
[8] K. Anderson, N. A. DiOrio, D. S. Cutler, and R. S. Butt, “Increasing Resiliency Through Renewable Energy Microgrids,” Int. J. Energy Sect. Manag., vol. 2, no. 2, pp. 1–16, 2017.
[9] K. Anderson et al., “Quantifying and monetizing renewable energy resiliency,” Sustainability, vol. 10, no. 4, p. 933, 2018.
[10] N. D. Laws, K. Anderson, N. A. DiOrio, X. Li, and J. McLaren, “Impacts of valuing resilience on cost-optimal PV and storage systems for commercial buildings,” Renew. Energy, vol. 127, pp. 896–909, 2018.
[11] A. Lagrange, M. de Simón-Martín, A. González-Martínez, S. Bracco, and E. Rosales-Asensio, “Sustainable microgrids with energy storage as a means to increase power resilience in critical facilities: An application to a hospital,” Int. J. Electr. Power Energy Syst., vol. 119, p. 105865, 2020.
[12] E. Rosales-Asensio, M. de Simón-Martín, D. Borge-Diez, J. J. Blanes-Peiró, and A. Colmenar-Santos, “Microgrids with energy storage systems as a means to increase power resilience: An application to office buildings,” Energy, vol. 172, pp. 1005–1015, 2019.
[13] J. Faraji, M. Babaei, N. Bayati, and M. A. Hejazi, “A comparative study between traditional backup generator systems and renewable energy based microgrids for power resilience enhancement of a local clinic,” Electronics, vol. 8, no. 12, p. 1485, 2019.
[14] T. M. Azerefegn, R. Bhandari, and A. V. Ramayya, “Techno-economic analysis of grid-integrated PV/wind systems for electricity reliability enhancement in Ethiopian industrial park,” Sustain. Cities Soc., vol. 53, p. 101915, 2020.
[15] C. Bastholm and F. Fiedler, “Techno-economic study of the impact of blackouts on the viability of connecting an off-grid PV-diesel hybrid system in Tanzania to the national power grid,” Energy Convers. Manag., vol. 171, pp. 647–658, 2018.
[16] S. U. Rehman, S. Rehman, M. Shoaib, and I. A. Siddiqui, “Feasibility Study of a Grid-Tied Photovoltaic System for Household in Pakistan: Considering an Unreliable Electric Grid,” Environ. Prog. Sustain. Energy, vol. 38, no. 3, pp. 1–8, 2019.
[17] A. S. Aziz, M. F. N. Tajuddin, M. R. Adzman, M. F. Mohammed, and M. A. M. Ramli, “Feasibility analysis of grid-connected and islanded operation of a solar PV microgrid system: A case study of Iraq,” Energy, vol. 191, p. 116591, 2020.
[18] F. Tooryan, A. Shadman, S. Kamalinia, and E. R. Collins, “Techno-Economic Analysis and Power Management for Remote Area Microgrid,” in Clemson University Power Systems Conference (PSC), 2020, pp. 1–6“Techno-Economic Analysis and Power Management for Remote Area Microgrid,” in Clemson University Power Systems Conference (PSC), Clemson, SC: IEEE, 2020, pp. 1–6.
[19] R. Mehta, “A Microgrid Case Study for Ensuring Reliable Power for Commercial and Industrial Sites,” in IEEE PES GTD Grand International Conference and Exposition Asia (GTD Asia), 2019, pp. 594–598“A Microgrid Case Study for Ensuring Reliable Power for Commercial and Industrial Sites,” in IEEE PES GTD Grand International Conference and Exposition Asia (GTD Asia), Bangkok, Thailand: IEEE, 2019, pp. 594–598.
[20] D. T. Ton and M. A. Smith, “The U.S. Department of Energy’s Microgrid Initiative,” Electr. J., vol. 25, no. 8, pp. 84–94, 2012.
[21] C. Schwaegerl and L. Tao, “What is a Microgrid?,” in Microgrids Architectures and Control, 1st ed., N. Hatziargyriou, Ed. Chichester, UK: John Wiley & Sons Ltd, 2014, pp. 1–24.
[22] H. Farhangi, Smart Microgrids : Lessons from Campus Microgrid Design and Implementation, 1st ed. Taylor & Francis Group, 2016.
[23] A. Faruqui and C. Bourbonnais, “The Tariffs of Tomorrow: Innovations in Rate Designs,” IEEE Power & Energy Magazine, vol. 18, no. 3, pp. 18–25, 2020.
[24] R. Hledik, “Rediscovering Residential Demand Charges,” Electr. J., vol. 27, no. 7, pp. 82–96, 2014.
[25] J. Shen, C. Jiang, Y. Liu, and J. Qian, “A Microgrid Energy Management System with Demand Response for Providing Grid Peak Shaving,” Electr. Power Components Syst., vol. 44, no. 8, pp. 843–852, 2016.
[26] L. Zhou, Y. Zhang, X. Lin, C. Li, Z. Cai, and P. Yang, “Optimal sizing of PV and bess for a smart household considering different price mechanisms,” IEEE Access, vol. 6, pp. 41050–41059, 2018.
[27] R. Garmabdari, M. Moghimi, F. Yang, E. Gray, and J. Lu, “Multi-objective energy storage capacity optimisation considering Microgrid generation uncertainties,” Int. J. Electr. Power Energy Syst., vol. 119, no. February, p. 105908, 2020.
[28] A. Kadri and K. Raahemifar, “Optimal Sizing and Scheduling of Battery Storage System Incorporated with PV for Energy Arbitrage in Three Different Electricity Markets,” in IEEE Canadian Conference of Electrical and Computer Engineering (CCECE), 2019, pp. 1–6“Optimal Sizing and Scheduling of Battery Storage System Incorporated with PV for Energy Arbitrage in Three Different Electricity Markets,” in IEEE Canadian Conference of Electrical and Computer Engineering (CCECE), Edmonton, AB, Canada: IEEE, 2019, pp. 1–6.
[29] M. H. Roos, D. A. M. Geldtmeijer, H. P. Nguyen, J. Morren, and J. G. Slootweg, “Optimizing the technical and economic value of energy storage systems in LV networks for DNO applications,” Sustain. Energy, Grids Networks, vol. 16, pp. 207–216, 2018.
[30] W. L. Schram, I. Lampropoulos, and W. G. J. H. M. van Sark, “Photovoltaic systems coupled with batteries that are optimally sized for household self-consumption: Assessment of peak shaving potential,” Appl. Energy, vol. 223, pp. 69–81, 2018.
[31] A. Mariaud, S. Acha, N. Ekins-Daukes, N. Shah, and C. N. Markides, “Integrated optimisation of photovoltaic and battery storage systems for UK commercial buildings,” Appl. Energy, vol. 199, pp. 466–478, 2017.
[32] Y. Li and J. Wu, “Optimum Integration of Solar Energy With Battery Energy Storage Systems,” IEEE Trans. Eng. Manag., vol. (in press), 2020.
[33] J. Liu, X. Chen, H. Yang, and Y. Li, “Energy storage and management system design optimization for a photovoltaic integrated low-energy building,” Energy, vol. 190, p. 116424, 2020.
[34] A. Sharma and M. Kolhe, “Techno-economic evaluation of PV based institutional smart micro-grid under energy pricing dynamics,” J. Clean. Prod., vol. 264, p. 121486, 2020.
[35] M. B. Roberts, A. Bruce, and I. MacGill, “Impact of shared battery energy storage systems on photovoltaic self-consumption and electricity bills in apartment buildings,” Appl. Energy, vol. 245, pp. 78–95, 2019.
[36] A. A. Eras-Almeida, M. A. Egido-Aguilera, P. Blechinger, S. Berendes, E. Caamaño, and E. García-Alcalde, “Decarbonizing the Galapagos Islands: Techno-economic perspectives for the hybrid renewable mini-grid Baltra-Santa Cruz,” Sustainability, vol. 12, no. 6, p. 2282, 2020.
[37] M. A. Mohamed, T. Chen, W. Su, and T. Jin, “Proactive Resilience of Power Systems against Natural Disasters: A Literature Review,” IEEE Access, vol. 7, pp. 163778–163795, 2019.
[38] HOMER Energy by UL, “HOMER Grid. Intelligently Reduce Demand Charges with HOMER Grid,” 2020. [Online]. Available: https://www.homerenergy.com/products/grid/. [Accessed: 30-Jun-2020].
[39] U.S. Energy Information Administration, “Average Price of Electricity to Ultimate Customers by End-Use Sector,” 2020. [Online]. Available: https://www.eia.gov/electricity/monthly/epm_table_grapher.php?t=epmt_5_6_a. [Accessed: 01-Sep-2020].
[40] U.S. Energy Information Administration, “Delaware State Profile and Energy Estimates,” 2019. [Online]. Available: https://www.eia.gov/state/?sid=DE#tabs-4. [Accessed: 02-Sep-2020].
[41] U.S. Energy Information Administration, “Delaware Electricity Profile 2018,” 2020. [Online]. Available: https://www.eia.gov/electricity/state/delaware/index.php. [Accessed: 31-Aug-2020].
[42] M. Deru et al., “U.S. Department of Energy commercial reference building models of the national building stock,” Technical Report NREL/TP-5500-46861, 2011. [Online]. Available: https://www.nrel.gov/docs/fy11osti/46861.pdf.
[43] Office of Energy Efficiency & Renewable Energy (EERE), “Commercial and Residential Hourly Load Profiles for all TMY3 Locations in the United States,” 2013. [Online]. Available: https://openei.org/datasets/dataset/commercial-and-residential-hourly-load-profiles-for-all-tmy3-locations-in-the-united-states. [Accessed: 31-Aug-2020].
[44] Folsom Labs, “HelioScope. The new standard in solar design software,” 2020. [Online]. Available: https://www.helioscope.com/. [Accessed: 30-Jun-2020].
[45] HOMER Energy, “Modified Kinetic Battery Model,” 2017. [Online]. Available: https://www.homerenergy.com/products/grid/docs/1.7/modified_kinetic_battery_model.html. [Accessed: 31-Aug-2020].
[46] L. Goldie-Scot, “A Behind the Scenes Take on Lithium-ion Battery Prices,” BloombergNEF, 2019. [Online]. Available: https://about.bnef.com/blog/behind-scenes-take-lithium-ion-battery-prices/. [Accessed: 19-Jun-2020].
[47] W. Cole and A. W. Frazier, “Cost Projections for Utility-Scale Battery Storage Cost Projections for Utility- Scale Battery Storage,” 2019.
[48] M. Woodhouse, B. Smith, A. Ramdas, and R. Margolis, “Crystalline Silicon Photovoltaic Module Manufacturing Costs and Sustainable Pricing: 1H 2018 Benchmark and Cost Reduction Roadmap,” 2019.
[49] Lazard, “Lazard’s Levelized Cost of Storage Analysis,” 2018. [Online]. Available: https://www.lazard.com/media/450774/lazards-levelized-cost-of-storage-version-40-vfinal.pdf.