Abstract
Introduction: Serum vitamin D levels depend on sunlight, diet, and other factors. Objective: We aimed to determine serum vitamin D levels and evaluate their relationship with anthropometric indicators and lifestyle habits in apparently healthy volunteers. Materials and Methods: In this cross-sectional study (n=75), socio-demographic, anthropometric, and lifestyle habit-related data were collected. Serum vitamin D levels were determined with high performance liquid chromatography, food intake was measured by semiquantitative frequency and nutritional status was assessed by anthropometry. Chi-square test and also principal component analysis were used to analyze the relationship between some variables and vitamin D status. Spearman’s test was used to determine correlations between quantitative variables. Results: 73% were women and 61% belonged to medium socio-economic level. Median vitamin D intake was 137 (83.1–227.3) IU/day. Based on body mass index (BMI), 44% individuals had overweight/obesity. The 68% exhibited deficient/insufficient vitamin D levels (Hypovitaminosis D). BMI classification and waist circumference (CW) were not related with vitamin D status; however, activities with higher sun exposure were highly related (p = 0.013). Sun exposure time explained variation in component 2 (16.60%), where most of the individuals with normal level were grouped. Sun exposure time was positively correlated with vitamin D status (r = 0.263; p = 0.023). Discussion: Excess weight and abdominal obesity are not always associated with hypovitaminosis D. Conclusions: The majority of individuals showed hypovitaminosis D but their status was not related with anthropometric indicators. A Sun exposure time was the only factor positively correlated with vitamin D status.
KeyWords: Vitamin D, Anthropometry, Life Style, Sunlight, Healthy Volunteers
Resumen
Introducción: Los niveles séricos de vitamina D dependen de la luz solar, la dieta y otros factores. Objetivo: Nuestro objetivo fue determinar los niveles séricos de vitamina D y evaluar su relación con indicadores antropométricos y estilos de vida en voluntarios aparentemente sanos. Materiales y métodos: En este estudio trasversal (n=75) se recogieron datos sociodemográficos, antropométricos y aquellos relacionados con hábitos y estilos de vida. La vitamina D se determinó por cromatografía liquida de alta eficiencia; la ingesta de alimentos, mediante frecuencia semicuantitativa, y el estado nutricional por antropometría. Para analizar la relación entre algunas variables y el estado de la vitamina D se usó la prueba de Chi cuadrado y también el análisis de componentes principales. Se empleó la prueba de Spearman para determinar la correlación entre variables cuantitativas. Resultados: El 73% eran mujeres y el 61% pertenecían a un estrato socioeconómico medio. La mediana de la ingesta de vitamina D fue de 137 (83,1–227,3) UI/día. Según el índice de masa corporal (IMC), el 44% de los individuos tenían sobrepeso/obesidad. El 68% mostro deficiencia/insuficiencia de vitamina D (hipovitaminosis D). La clasificación del IMC y la circunferencia abdominal no se relacionaron con el estado de la vitamina D; sin embargo, las actividades con una mayor exposición solar estuvieron altamente relacionadas (p=0,013). El tiempo de exposición solar explico la variación en el componente 2 (16,60%) donde se agruparon la mayoría de los individuos con niveles normales. El tiempo de exposición solar tuvo una correlación positiva con el estado de la vitamina D (r = 0,263; p = 0,023). Discusión: El exceso de peso y la obesidad abdominal no siempre se relacionan con la hipovitaminosis D. Conclusiones: La mayoría de los individuos presentaron hipovitaminosis D, pero su estado no se relacionó con los indicadores antropométricos. El tiempo de exposición al sol fue el único factor que se correlaciono positivamente con el estado de la vitamina D.
Palabras Clave: Vitamina D, Antropometría, Estilo de Vida, Luz Solar, Voluntarios Sanos
Resumo
Introdução: Os níveis séricos de vitamina D dependem da luz solar, da dieta e de outros fatores. Objetivo: Nosso objetivo foi determinar os níveis séricos de vitamina D e avaliar sua relação com indicadores antropométricos e hábitos de vida em voluntários aparentemente saudáveis. Materiais e métodos: Neste estudo transversal (n=75), foram coletados dados sociodemográficos, antropométricos e relacionados a hábitos de vida. Os níveis séricos de vitamina D foram determinados por cromatografia liquida de alto desempenho, a ingestão de alimentos foi medida por frequência semiquantitativa e o estado nutricional foi avaliado por antropometria. O teste do qui-quadrado e a análise de componentes principais foram utilizados para analisar a relação entre algumas variáveis e o estado da vitamina D. O teste de Spearman foi usado para determinar as correlações entre as variáveis quantitativas. Resultados: 73% eram mulheres e 61% pertenciam a um nível socioeconômico médio. A ingestão media de vitamina D foi de 137 (83,1-227,3) UI/dia. Com base no índice de massa corporal (IMC), 44% dos indivíduos tinham sobrepeso/obesidade. Os 68% apresentaram níveis deficientes/insuficientes de vitamina D (hipovitaminose D). A classificação do IMC e a circunferência da cintura (CW) não foram relacionadas ao status da vitamina D; entretanto, as atividades com maior exposição ao sol foram altamente relacionadas (p = 0,013). O tempo de exposição ao sol explicou a variação no componente 2 (16,60%), onde a maioria dos indivíduos com nível normal foi agrupada. O tempo de exposição ao sol foi positivamente correlacionado com o status de vitamina D (r = 0,263; p = 0,023). Discussão: O excesso de peso e a obesidade abdominal nem sempre estão associados com a hipovitaminose D. Conclusões: A maioria dos indivíduos apresentou hipovitaminose D, mas seu status não foi relacionado com indicadores antropométricos. O tempo de exposição ao sol foi o único fator positivamente correlacionado com o status da vitamina D.
Palavras-Chave: Vitamina D, Antropometria, Estilo de Vida, Luz Solar, Voluntários Saudáveis.
Introduction
Vitamin D is a micronutrient of great importance to human health, it has a rol in bone homeostasis but also it functions as a hormone affecting physiological processes such as secretion and effectiveness of insulin, regulation of the renin-angiotensin-aldosterone system, immune system activation and cell cycle control and apoptosis. Moreover, vitamin D deficiency is related to a higher risk of diabetes mellitus, cardiovascular, oncologic, infectious, and autoimmune diseases1.
The main source of vitamin D is exposure to ultraviolet B (UV-B) rays from sunlight whereas foods such as salmon, tuna, eggs, and fortified foods like milk, margarine, and processed cereals for breakfast represent minor sources2.
Factors related to synthesis, lifestyle habits, obesity, malabsorption, hepatic and renal diseases and some drugs could, promote a deficit of this vitamin. Vitamin D deficiency can lead to osteomalacia and osteoporosis, there is also an increased risk of bone pain, bone fractures, muscle pain and muscle weakness. In older adults, severe deficiency may contribute to an increased risk of falls3.
The medical literature states that overweight or obese individuals have lower vitamin D levels. The mechanisms underlying this relationship are correlated to vitamin D retention in the adipose tissue, an increase in catabolism due to the localized action of the 24-hydroxylase, or a decrease in hepatic hydroxylation. In addition, there could be other underlying reasons pertaining to the lifestyle habits of overweight individuals, such as fewer outdoor activities and using clothes that cover the body more4.
It is estimated that almost a billion people globally suffer from a deficiency of vitamin D. In the United States, Canada, Mexico, Europe, and Australia, deficiency/insufficiency are between 30% and 50% of the population, including adults and children2. This situation is even more severe in older adults in the United States and Europe, where 100% people are reported to have vitamin D deficiency5. In a systematic review, the prevalence of vitamin D deficiency was assessed in a healthy population from all ages in South America and the Caribbean, reporting deficient levels of this vitamin (≤20 ng/mL) in 20%–40% population6. In Colombia, a vitamin D deficiency has been observed in patients with osteoporosis and two-thirds of postmenopausal women could have low levels of vitamin D7. However, in Medellín Colombia, there are no studies in healthy adults that evaluate the serum levels of vitamin D and relate them to anthropometric indicators and lifestyles.
The aim of this study was to determine the serum levels of vitamin D and explore its relationship with anthropometric indicators and lifestyle habits.
This study is relevant from public healthcare perspective because vitamin D deficiency/insufficiency implies long-term high morbidity and mortality in chronic diseases, which constitute health problems in Colombia. Therefore, it is necessary to focus the efforts in solving this issue and to plan preventive and intervention strategies.
Materials and Methods
Type of study and population
An analytical cross-sectional study was conducted on 75 adult volunteers, aged 18-60 years from Universidad de Antioquia and the Corporación para Investigaciones Biológicas (CIB); in the city of Medellin, Colombia. The study was done at these two institutions because the researchers work there and it facilitated the recruitment of participants. The subjects had to be apparently healthy at the time of their recruitment into the study, without any suggestion of liver, kidney autoimmune or gastrointestinal disease.
Individuals who used multivitamin supplements, medication, psychotropic drugs and who had an alcohol intake of >180 mL/day were excluded. Furthermore, pregnant women, lactating women, and smokers were also excluded.
For recruitment of participants, we set up an open call at the above mentioned institutions. E-mails were sent with the project’s briefing, explaining relevant dates.
All volunteers were assessed regarding the inclusion criteria. A peripheral blood sample (12 mL) was drawn from 125 participants to determine vitamin D serum levels.
In the second call, 75 participants attended. They were subjected to a personalized interview with nutrition students from the last year inquiring sociodemographic, anthropometric data inquiring socio-demographic, anthropometric, lifestyle habits (sun exposure/minutes per day, use of sunscreen, color of regularly used clothes, and sun exposure of limbs), skin type, and vitamin D intake. The sample was collected for six months. For the analysis, the participants were grouped according to their age as follows 18-25, 26-35 and >35 years; subjects were classified into these three age categories because they were grouped by tertiles to make the distribution more even. Three categories were established according to their socio-economic level: high (levels 5 and 6), medium (levels 3 and 4), and low (levels 1 and 2). Furthermore, they were categorized into high and low exposure according to their employment type depending on whether they conduct activities in open or closed spaces.
Additionally, lifestyle habit variables were also categorized. The use of sunscreen was determined according to the level of sun protection factor (SPF): appropriate protection (SPF ≥40), low protection (SPF10 and SPF30), and no protection. The exposure to sunlight of the limbs was grouped as high (>3 limbs), low (1 or 2 limbs), and none.
Skin color was determined following Von Luschan’s and Fitzpatrick’s chromatic scales. This color palette scale was compared with the internal area of the forearm and characterized with a number, where number 1 corresponded to light skin and number 36 to dark skin8. The latter scale was used during a personalized interview to obtain information about sunburn and the ability to tan, estimating the skin’s tolerance to ultraviolet (UV) light9. Finally, we considered the results from both scales and categorized the participants as follows: light sensitivity (phototypes I and II), normal sensitivity (phototypes III and IV), and tolerance to sunlight (phototypes V and VI).
Dietary Data
For the intake questionnaire, food sources of vitamin D published by Zuluaga N et al. natural sources such as various types of fish, egg yolk and mushrooms were included, as well as fortified foods such as milk, yogurt, margarine and breakfast cereals1. Additionally, we evaluated several nutritional content labels on different products from supermarkets in the city of Medellin with the aim of including foods fortified with vitamin D. The questionnaire included 20 foods and it was tested on students from the Universidad de Antioquia. To quantify the participant’s intake of each food, we used a quantitative frequency method for the list of 20 foods. Food items were separated into modules on the basis of portion size and weight (in grams) to quantify intake of solid foods. For liquid foods, we used photographs of glasses, mugs, bowls, and spoons to estimate the quantity in milliliters. The data obtained were recorded in the food-frequency instrument for consumption of food sources of vitamin D. Subsequently, the amount of vitamin D corresponding to the 20 foods was entered in an Excel sheet and the frequency of food intake (daily, weekly, or monthly) of each participant was recorded. Next, the daily average intake of vitamin D was calculated.
Anthropometric measurements
We conducted an anthropometric assessment followed Lohman´s method10. The body weight was measured in kg using a TANITA digital scale (sensitivity of 0.1 kg) (model HD-313, TANITA, Arlington Heights, IL, US); height was measured in cm with a SECA wall stadiometer (sensitivity of 0.1 cm) (model 206, SECA, Hammer Steindamm, HSV, BRD); CW was measured between the last rib and the iliac crest using a SECA metric measuring tape (sensitivity of 0.1 cm) (model 201, SECA, Hammer Steindamm, HSV, BRD).
We classified the participants based on their BMI according to the categories stated by the World Health Organization as follows: appropriate weight, 18.5–24.9 kg/m2; overweight, 25–29.9 kg/m2; and obese >30 kg/m211. To establish the abdominal obesity related to CW, we used the following indications recommended by the International Diabetes Federation: for men no risk (<90 cm), high risk (90–102 cm), and very high risk (>102 cm); and for women no risk (<80 cm), high risk (80–88 cm), and very high risk (>88 cm)12.
Vitamin D measurement
To determine vitamin D serum levels, we quantified 25-hydroxivitamin D3 (25-(OH)D3) using high performance liquid chromatography (HPLC) with ultraviolet (UV) detection model 1200, Agilent Technology, Santa Clara, CA, US13. The 25-(OH)D3 is considered the most abundant metabolite precursor of vitamin D and best reflects the level status of this vitamin in the body14. For the classification of vitamin D levels, we followed the Endocrine Society Clinical Practice Guideline: normal (30–150 ng/mL), insufficient (21–29 ng/mL), deficient (<20 ng/mL)15. We used only two classifications for their analysis, normal ≥ 30 ng/mL and low values < 30 ng/mL, in which both the deficient and the insufficient are found.
Statistical analysis
The statistical analyses was performed with the Statistical Package for Social Sciences software, SPSS (version 24.0, SPSS Inc, Chicago, IL, USA). The database was stored in Mendeley Data16. The quantitative variables were described by central and dispersion tendency measures. Qualitative variables were described by frequencies and percentages. We used Chi-square or Fisher’s test to analyze the association among status of vitamin D and socio-demographic and lifestyle habits variables. The Mann Whitney´s U test was used to determine the relation among average BMI and waist circumference with the vitamin D classification. In either case an exploratory analysis of the variables was conducted by a principal components analysis (PCA) with the help of Rstudio; in addition, Packages FactoMineR and Factoextra were used for the analysis. To establish a correlation between the vitamin D serum levels and the quantitative variables such as age, BMI, vitamin D intake, and sun exposure time, we used the ggplot2 package in Rstudio. The defined significance level was p <0.05. To confirm the correlations between variables, we performed linear regressions of the significant variables using the Stats package in Rstudio. The charts were created using GraphPad Prism (version 5, GraphPad Ind, San Diego, CA, US) and Rstudio (RStudio Inc, Boston, MA, US).
Ethical considerations
According to the principles of the Declaration of Helsinki and the Ministerio de Salud de Colombia in the Section 11, Resolution Number 008430 of October 1993, this research is classified as minimal ethical risk. The CIB’s bioethics committee ratified and approved the methods for this study in the minutes # 101. Prior to beginning the study, all participants signed a consent form.
Results
Participants' characteristics
The median aged was 30 years, interquartile range (IQR 24 – 41). Seventy-three percent of the participants were women n (55), 61.33% n (46) belonged to the medium socio-economic level, 53.27% n (46) were aged 18–35 years, and 70.33% n (63) had normal sun sensitivity (Table 1). According to the BMI, 44.00% of the individuals were overweight or obese, 29 (38.60%) were overweight and 6 (8.00%) obese. According to the waist circumference, 25.33% n (19) of the individuals had abdominal obesity (Table 2).
Median vitamin D intake was of 137 IU (IQR 83.1–227.3) and median sun exposure time was 30 min (IQR 15–60).
Among subjects >35 years of age, 80.80% n (21) had deficiency / insufficiency levels vitamin D. Moreover, 69.10% n (38) of women and 65.00% n (13) of men showed deficient/insufficient levels. Interestingly, individuals who belonged to the high socio-economic level showed a higher proportion of serum vitamin D deficiency/insufficiency (78.6%), n (11) whereas the ones who belonged to lower socio-demographic levels showed lesser deficiency/insufficiency (53.30%) n (8). Regarding individual’s employment type and their exposure to sunlight, it was found that those with a higher sun exposure (60.00%) n (9) exhibit normal serum vitamin D levels, whereas of those with lower exposure to sunlight, 25.00% n (15) had normal levels (p=0.013). In the group using darker clothes, 80.00% n (24) of individuals showed deficient/insufficient vitamin D. The majority of the individuals with normal levels of vitamin D (62.50%) n (5), had more number of limbs exposed to the sunlight (Table 1).
Table 1. Differentiation between groups according to classification of vitamin D levels and socio-demographic and lifestyle variables
Variable |
Groups |
| Deficient/insufficient (n=51) |
Normal (n = 24) |
Chi2 |
| n |
Frequency % |
n |
Frequency % |
p |
Age group |
18-25 |
26-35 |
>35 |
|
|
|
|
|
|
|
|
|
|
|
|
Socio-economic level |
High
Medium
Low |
|
|
|
|
|
|
Employment |
High sun exposure
Low sun exposure |
|
|
|
|
|
|
SPF level (Sun Protection Factor) |
Adequate
Low
No protection |
|
|
|
|
|
|
Clothes color |
Dark
White
Mixed |
|
|
|
|
|
|
Limb exposure |
High
Low
None |
|
|
|
|
|
|
Skin phototype |
Sunlight sensitivity |
Normal sensitivity |
Tolerance to sunlight |
|
|
|
|
|
|
Results are presented by row *Fisher's exact test
Statistical significance of difference is calculated between subjects with and without vitamin D deficiency.
Relationship between anthropometric measurements and vitamin D serum levels
According to anthropometric measurements, 60.60% n (20) of overweight/obesity participants and 57.90% n (11) of high CW (abdominal obesity), presented deficiency/insufficiency vitamin D. Despite the fact that hypovitaminosis D was more frequent in individuals with excess weight and abdominal obesity, there were no statistically significant differences between the nutritional state and vitamin D serum level classification when Chi-square test was used
(Table2).
Table 2. Differentiation between groups according classification of vitamin D levels and anthropometric parameters
Variable |
Groups |
| Deficient/insufficient (n=51) |
Normal (n = 24) |
Chi2 |
| n |
Frequency % |
n |
Frequency % |
p |
Waist circumference |
High (abdominal obesity) |
Normal |
|
|
|
|
|
|
BMI |
Adequate |
Thinness |
Overweight/obesity |
|
|
|
|
|
|
Results are presented by row *Fisher's exact test
Statistical significance of difference is calculated between subjects with and without vitamin D deficiency.
When average BMI and CW were analyzed in relation with vitamin D status using Mann–Whitney U-test, no statistically significant differences were found in either case.
Multivariate analysis
The PCA was conducted with the data of 69 participants. Six participants identified as outliers were excluded. PCA showed that components 1 and 2 explained the 36.20% variance. Sunlight exposure and vitamin D serum levels are the parameters which can explain the greater variance of component 2 (16.60%), where most of the individuals classified as normal are present. This allows for a distinction of this group from the deficient/insufficient one (Figure 1). Employment with outdoor activities and vitamin D intake are the parameters that can better explain the variance of component 1 (19.60%) in which most of the individuals with deficient/insufficient serum levels of vitamin D can be found, allowing a separation from the group with normal vitamin D levels. None of the other factors analyzed were significant in this data set (Figure1).
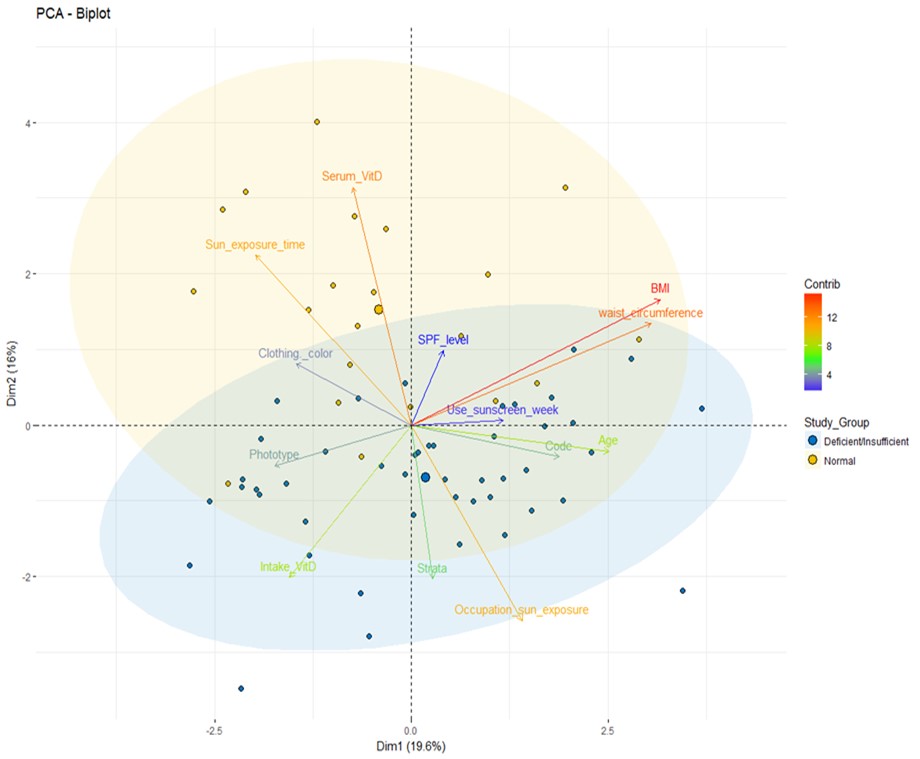
Figure 1. A principal components analysis
The dots show the separation between the two groups studied according to the socio-economic variables and other factors related to vitamin D: deficient/insufficient (blue) and normal (yellow). The color scale of each arrow and the name of each variable represent how much does each variable contribute to the main component, red being the one that contributes the most and blue being the one contributing less (see color scale to the right).
To establish the correlation between vitamin D serum levels with different variables such as age, vitamin D intake, waist circumference, BMI, and time of sunlight exposure, we used Spearman’s test. A significant positive correlation between vitamin D serum levels and time of sunlight exposure (p= 0.002); age and CW (p= 0.006); age and BMI (p= 0.01); and CW and BMI (p= 0.001) were observed (Figure2).
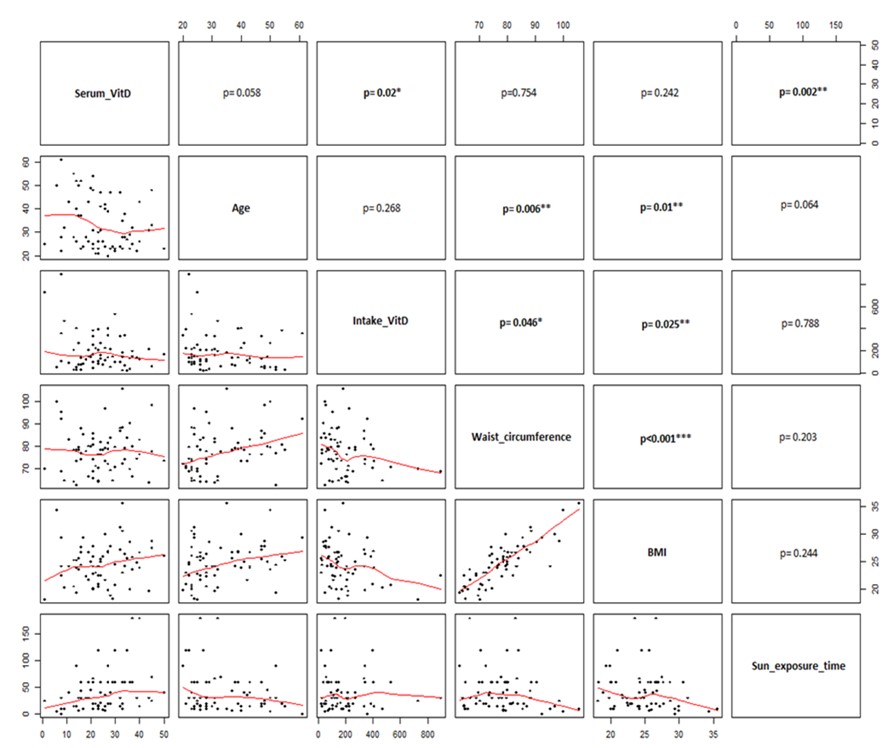
Figure 2. Correlation between anthropometric variables and factors related to vitamin D levels.
The lower panels show the distribution of raw data (black dots) and the red line indicates the smoothened trend. The upper panels show the p values of the different correlations. The correlations indicating a relevant p value are indicated with boldface (*p < 0.05; **p < 0.01; y *** p < 0.001).
To verify the correlation results, we individually performed linear regression of the variables of time of sunlight exposure (in minutes) with vitamin D serum levels, showing a positive correlation with sun exposure (R2= 0.136 p= 0.002) (Figure3).
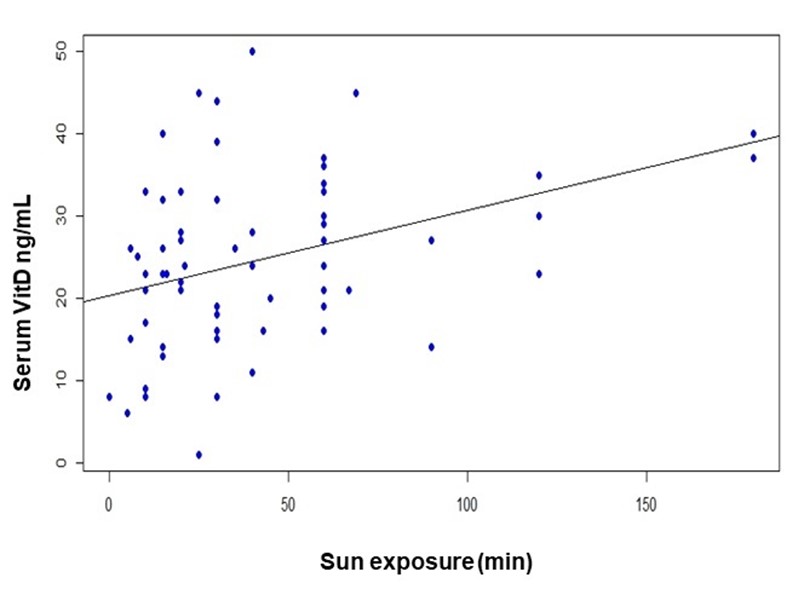
Figure 3. Linear regression between Vitamin D serum levels and sun exposure time (min)
Discussion
Although this study was conducted on apparently healthy adults, the proportion of individuals with deficient/insufficient serum vitamin D levels was surprisingly high (68%), despite the city of Medellin, Colombia, being at a tropical latitude (6°13’1" N, 75°34’1’’ W). The proportion of individuals with deficient/insufficient vitamin D was higher than those reported in Saudi Arabia (51.7%)17 and Singapore (42%)18; our results were similar to those reported in Brazil (64.2%)19, but lower than those reported in Gansu province, China (93,7%)20.
These differences could be attributed to techniques used to determine vitamin D serum levels; some studies used chemiluminescence immunoassay (CLIA) test14, whereas others used tandem mass spectrometry coupled with liquid chromatography (MS/MS-LC)13, and in this study we used HPLC. MS/MS-LC and HPLC offer a higher sensitivity in 25(OH)D3 metabolite detection. In addition, the system of classifying individuals on the basis of vitamin D serum levels was different in one of these studies17.
We did not find any significant differences between BMI or CW between individual with normal levels and those with deficient/insufficient levels of vitamin D according with other studies in adults21,22. Khader et al. in Jordan used sample of adults aged >18 years and reported no significant statistical association between vitamin D levels and the metabolic syndrome components such as CW and BMI23. Khan et al. also failed to find any significant association between vitamin D status and obesity24. Conversely, Rocha et al., in Brazil, found an association between high BMI and deficient vitamin D levels19, and Cartier et al. found that25 (OH)D3 negatively correlated with BMI25.
Recently Mansouri et al, in a study with professors, concluded that serum 25(OH)D concentrations were inversely associated with general and abdominal obesity either before or after controlling for potential confounders26. Similar findings were reported by Hajhashemy et al in a systematic review and meta-analysis of epidemiologic studies, finding that serum vitamin D level was inversely associated with risk of abdominal obesity in adults, in a dose–response manner27. These differences may be due to the fact that both studies used cut-off points to classify obesity, different from ours. In addition, in the meta-analysis they did not include in the Forest plots, studies from South American countries, which have different lifestyle habits.
The average vitamin D intake in this study was 182.4 ± 138.2 IU/day. This value is higher than the one reported by Martini et al. (130.8 ± 66.0 IU/day in adult men and 108.8 ± 55.6 IU/day in adult women)28. These differences could be attributed to the diversities in the methodology used for intake quantification. The Brazilian study19 used a 24-hour reminder, whereas this study recorded the intake frequency with a list of 20 foods sources of vitamin D.
The Institute of Medicine (IOM) in the United States revised the requirement of vitamin D and established that the Estimated Average Requirement (assuming minimum sun exposure) for people aged 1–70 years is 400 IU/day29. According to the results obtained from the studies mentioned before and despite the differences in the intake quantification methods, vitamin D consumption is lower than that recommended by the IOM and by the Energy and Nutrients Intake Recommendations for Colombian population30. Thus, there should be food fortification policies or campaigns on minimum sunlight exposure requirements so that people will achieve adequate levels of vitamin D. Regarding employment types wherein activities are conducted outdoors, this study confirmed that there is a higher proportion of individuals with normal levels of vitamin D (2:1) whose employment required a higher sunlight exposure; on the contrary, individuals with low sunlight exposure presented a higher proportion (3:1) of deficiency/insufficiency of vitamin D. This finding agrees with that reported in a systematic review stating that employees working in shifts, health professionals, and others working in close spaces have a greater risk of having a vitamin D deficiency owing to their lifestyle that leads to less exposure to UVB rays31.
Serum levels of 25(OH)D3 are a good indicator of accumulated sun exposure and dietary intake of vitamin D; estimation using this metabolite is widely known as the gold standard technique of estimating vitamin D status. UVB rays are the main source of vitamin D for the majority of individuals; however, adverse effects of UVB rays are frequently documented, particularly for people with fair skin. Thus, there has been an increase in the use of photo protectors, primarily sunscreens. This negatively affects vitamin D status. Furthermore, individuals with highly pigmented skin have a poor vitamin D status due to photoprotection provided by melanin2. In our study, sun exposure time was the only factor that was positively correlated with vitamin D serum levels, implying that UVB rays are the best source of the vitamin. In Spain, hypovitaminosis D was highly prevalent among primary health care users, and significantly higher in winter as compared to summer32.
Conclusion
The proportion of healthy individuals with deficient/insufficient vitamin D serum levels was quite high, and it was not associated with anthropometric indicators. Sunlight exposure time was the only factor positively correlated with these values. Although vitamin D deficiency/insufficiency does not necessarily indicate an overt disease, it implies a risk for chronic diseases; thus, it warrants immediate attention.
Vitamin D intake was lower than the recommended value, and this should alert the population of the risk it implies for their health.
A merit of our study is determining 25(OH)D3 levels using HPLC coupled with UV detection, which is a physical non-immunologic method of detection with a higher precision than that of the immunoassay.
Limitations
It is a cross-sectional study that does not measure exposure to a factor and the cause-effect relationship is not verifiable. There may be selection biases because the recruitment was done with volunteers and the population sample was not representative of the city. The measurement of vitamin D intake was made with a frequency of food consumption and there may be other more precise methods such as 24-hour recall on several days a week.
Conflict of interest: The authors have no conflicts of interest to declare
Source of funding: This study results from the wider project: In vitro evaluation of the vitamin D immunomodulatory effect on immune response cells in vitamin D deficient individuals using an infection model with Candida albicans, financed by Colciencias (Contract FP 44842-374-2014).
Acknowledgments
We thank all the volunteers who participated in this study, for their patience and collaboration, without them, this research would not have been possible. We also thank Juan David Zapata, pharmaceutical chemist and Sinar David Granada, chemist, for their support with the HPLC technique. We thank the University of Antioquia as well for allowing their professors to dedicate time to this study, and the Research Center on Human Nutrition and Food of Nutrition and Dietetics School for their financial support for the translation services
References
- Zuluaga N, Alfaro J, González V, Jiménez K, Campuzano G. Vitamina D: nuevos paradigmas. Med Lab. 2011;17:211–46. https://medicinaylaboratorio.com/index.php/myl/article/view/331
- Holick MF. The vitamin D deficiency pandemic: Approaches for diagnosis, treatment and prevention. Rev Endocr Metab Disord. 2017;18(2):153-165. https://doi.org/10.1007/s11154-017-9424-1
- Varsavsky M, Rozas Moreno P, Becerra Fernández A, Luque Fernández I, Quesada Gómez JM, Ávila Rubio V, et al. Recommended vitamin D levels in the general population. Endocrinol Diabetes Nutr. 2017;64 Suppl 1:7-14. https://doi.org/10.1016/j.endinu.2016.11.002
- Earthman C, Beckman L, Masodkar K, Sibley S. The link between obesity and low circulating 25-hydroxyvitamin D concentrations: considerations and implications. Int J Obes (Lond). 2012;36(3):387-396. https://doi.org/10.1038/ijo.2011.119
- Spiro A, Buttriss JL. Vitamin D: An overview of vitamin D status and intake in Europe. Nutr Bull. 2014;39(4):322–50. https://doi.org/10.1111/nbu.12108
- Barberán M, Aguilera G, Brunet L, Maldonado F. Déficit de vitamina D. Revisión epidemiológica actual. Rev Hosp Clínica la Univ Chile. 2014;25:127–34. https://www.enfermeriaaps.com/portal/wp-content/uploads/2017/05/D%C3%A9ficit-de-vitamina-D.-Revisi%C3%B3n-epidemiol%C3%B3gica-actual.pdf
- Vásquez-Awad D, Cano-Gutiérrez CA, Gómez-Ortiz A, González MA, Guzmán- R, Martinez-Reyes, JI et al. Vitamina D.Consenso colombiano de expertos. Revista Medicina. 2017;39:140–57. https://www.revistamedicina.net/index.php/Medicina/article/view/117-6
- Luschan F Von. Völker, Rassen, Sprachen: Anthropologische Betrachtungen, Deutsche Buchgemeinschaft, Berlin. 1927.
- Fitzpatrick TB. The validity and practicality of sun-reactive skin types I through VI. Arch Dermatol. 1988;124(6):869–71. https://doi.org/10.1001/archderm.124.6.869
- Lohman TG, Roche AF, Martorell R. Anthropometric standardization reference manual. Champaign, IL: Human Kinetics Books; 1988
- World Health Organization. Obesity: preventing and managing the global epidemic. Report of a WHO Consultation. Geneva World Heal Organ (Internet). 2000; Available from: URL: https://apps.who.int/iris/handle/10665/42330
- Alberti K, Zimmet P, Shaw J. Metabolic syndrome--a new world-wide definition. A Consensus Statement from the International Diabetes Federation. Diabet Med. 2006;23(5):469–80. https://doi.org/10.1111/j.1464-5491.2006.01858.x
- Hymøller L, Jensen SK. Vitamin D analysis in plasma by high performance liquid chromatography (HPLC) with C30 reversed phase column and UV detection – Easy and acetonitrile-free. J Chromatogr A. 2011;1218(14):1835–41. https://doi.org/10.1016/j.chroma.2011.02.004
- Dirks NF, Ackermans MT, Lips P, de Jongh RT, Vervloet MG, de Jonge R, et al. The when, what & how of measuring vitamin D metabolism in clinical medicine. Nutrients. 2018;10(4):482. https://doi.org/10.3390/nu10040482
- Holick MF, Binkley NC, Bischoff-Ferrari HA, Gordon CM, Hanley DA, Heaney RP, et al. Evaluation, treatment, and prevention of vitamin D deficiency: an Endocrine Society clinical practice guideline. J Clin Endocrinol Metab. 2011;96(7):1911–30. https://doi.org/10.1210/jc.2011-0385
- Giraldo Nubia; Ramírez Carolina; Idárraga Yelithza; Restrepo Ángela; Cano Luz Elena; Mejía Susana (2023), “Base de datos vitamina D”, Mendeley Data, V1, https://data.mendeley.com/datasets/c99p9jydvd
- Alsuwadia AO, Farag YM, Al Sayyari AA, Mousa DH, Alhejaili FF, Al-Harbi AS, et al. Prevalence of vitamin D deficiency in Saudi adults. Saudi Med J. 2013;34(8):814–8. https://pubmed.ncbi.nlm.nih.gov/23974452/
- Bi X, Tey SL, Leong C, Quek R, Henry CJ. Prevalence of vitamin D deficiency in Singapore: its implications to cardiovascular risk factors. PLoS One. 2016;11:e0147616. https://doi.org/10.1371%2Fjournal.pone.0147616
- Rocha LM, Baldan DC da S, Souza AL, Chaim EA, Pavin EJ, Alegre SM. Body composition and metabolic profile in adults with vitamin D deficiency Composição corporal e perfil metabólico na deficiência de vitamina D sérica em adultos. Rev Nutr. 2017;30:(4)19–30. https://doi.org/10.1590/1678-98652017000400002
- Liu J, Ma W, Wei L, Yang Y, Yang R, Shao F, et al. Adult serum 25(OH)D3 in Gansu province, northwest China: a cross-sectional study. Asia Pac J Clin Nutr. 2018;27(4):832–9. https://doi.org/10.6133/apjcn.092017.06
- Zhang Y, Zhang X, Wang F, Zhang W, Wang C, Yu C, et al. The relationship between obesity indices and serum vitamin D levels in Chinese adults from urban settings. Asia Pac J Clin Nutr. 2016;25(2):333–9. https://doi.org/10.6133/apjcn.2016.25.2.15
- Kim D, Kim J. Association between serum 25-hydroxyvitamin D levels and adiposity measurements in the general Korean population. Nutr Res Pract. 2016;10(2):206-11. https://doi.org/10.4162/nrp.2016.10.2.206
- Khader YS, Batieha A, Jaddou H, Batieha Z, El-Khateeb M, Ajlouni K. Relationship between 25-hydroxyvitamin D and metabolic syndrome among Jordanian adults. Nutr Res Pract. 2011;5(2):132–9. https://doi.org/10.4162%2Fnrp.2011.5.2.132
- Khan AH, Iqbal R, Naureen G, Dar FJ, Ahmed FN. Prevalence of vitamin D deficiency and its correlates: results of a community-based study conducted in Karachi, Pakistan. Arch Osteoporos. 2012;7:275–282. https://doi.org/10.1007/s11657-012-0108-x
- Cartier JL, Kukreja SC, Barengolts E. Lower serum 25-Hydroxivitamin D is associated with obesity but not common chronic conditions: an observational study of afrocan american and caucasian male veterans. Endocr Pract. 2017;23(3):271–8. https://doi.org/10.4158/ep161456.or
- Mansouri M, Miri A, Varmaghani M, Abbasi R, Taha P, Ramezani S et al. Vitamin D deficiency in relation to general and abdominal obesity among high educated adults. Eat Weight Disord. 2019;24, 83–90. https://doi.org/10.1007/s40519-018-0511-4
- Hajhashemy Z, Shahdadian F, Ziaei R, Saneei P. Serum vitamin D levels in relation to abdominal obesity: A systematic review and dose–response meta‐analysis of epidemiologic studies. Obesity Reviews. 2020;1–22. https://doi.org/10.1111/obr.13134
- Martini LA, Verly EJ, Marchioni DML, Fisberg RM. Prevalence and correlates of calcium and vitamin D status adequacy in adolescents, adults, and elderly from the Health Survey-Sao Paulo. Nutrition. 2013;29(6):845–50. https://doi.org/10.1016/j.nut.2012.12.009
- Institute of Medicine (US) Committee to Review Dietary Reference Intakes for Vitamin D and Calcium. Ross AC, Taylor CL, Yaktine AL,et al., editors. Washingt Natl Acad Press. 2011;260–2.
- Ministerio de Salud y Protección social. Recomendaciones de ingesta de energía y nutrientes para la población Colombiana. [Internet] 2016. Consulta: Marzo 15, 2022. Disponible en: https://www.minsalud.gov.co/sites/rid/Lists/BibliotecaDigital/RIDE/VS/PP/SNA/rien-documento-resumen.pdf
- Sowah D, Fan X, Dennett L, Hagtvedt R, Straube S. Vitamin D levels and deficiency with different occupations: a systematic review. BMC Public Health. 2017;17:519. https://doi.org/10.1186/s12889-017-4436-z
- Díaz-López A, Paz-Graniel I, Alonso-Sanz R, Marqués Baldero C, Mateos Gil C, Arija Val V. Vitamin D deficiency in primary health care users at risk in Spain. Nutr Hosp. 2021;38(5):1058-1067. https://dx.doi.org/10.20960/nh.03565